Data Source Node
The Data Source node allows you to connect your workflow to external data sources, such as databases, APIs, or third-party services. With the Data Source node, you can:
- Retrieve data from databases like PostgreSQL, MySQL, or MongoDB
- Fetch information from REST or GraphQL APIs
- Integrate with SaaS platforms such as ClickUp, Salesforce, or Slack
- Integrate AI APIs such as OpenAI or Anthropic
- Perform queries, filters, or transformations before passing data to other nodes
The Data Source node is essential for building dynamic workflows that depend on real-time data. It enables enterprise-level automation, reporting, and decision-making by seamlessly bringing external data into your workflow.
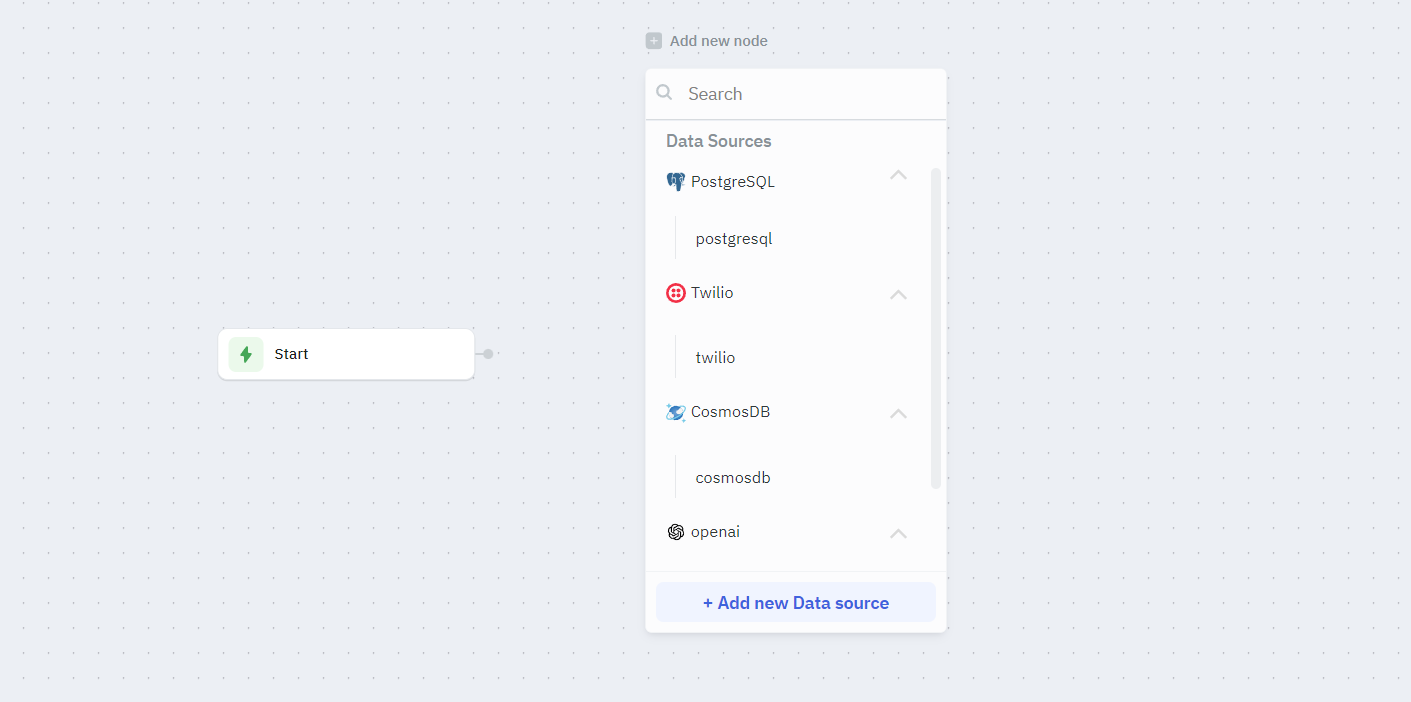
Each Data Source node has specific configurations based on its type:
- PostgreSQL: SQL query fields
- REST API: HTTP method, endpoint, headers
- Twilio: SMS configuration fields
- And more based on your configured sources
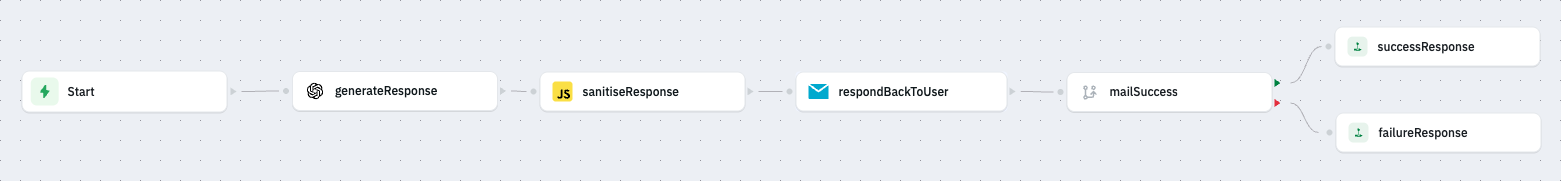
Example 1 - Customer Support Automation Workflow
Consider a workflow that automatically drafts an AI generated response to a customer support ticket.
Here's an overview of the workflow.
Input
For this example, the workflow receives input data in the following structure:
{
  "from": "[email protected]",
  "name": "John Doe",
  "data": "Hi, I've been using ToolJet and it's the best tool in the market!"
}
This payload comes from the source that triggers the workflow. In this case, the workflow is triggered through a Webhook, so the incoming request body provides this data. However, the same workflow could also be triggered by other sources such as another workflow or a ToolJet application as long as they send parameters in this format.
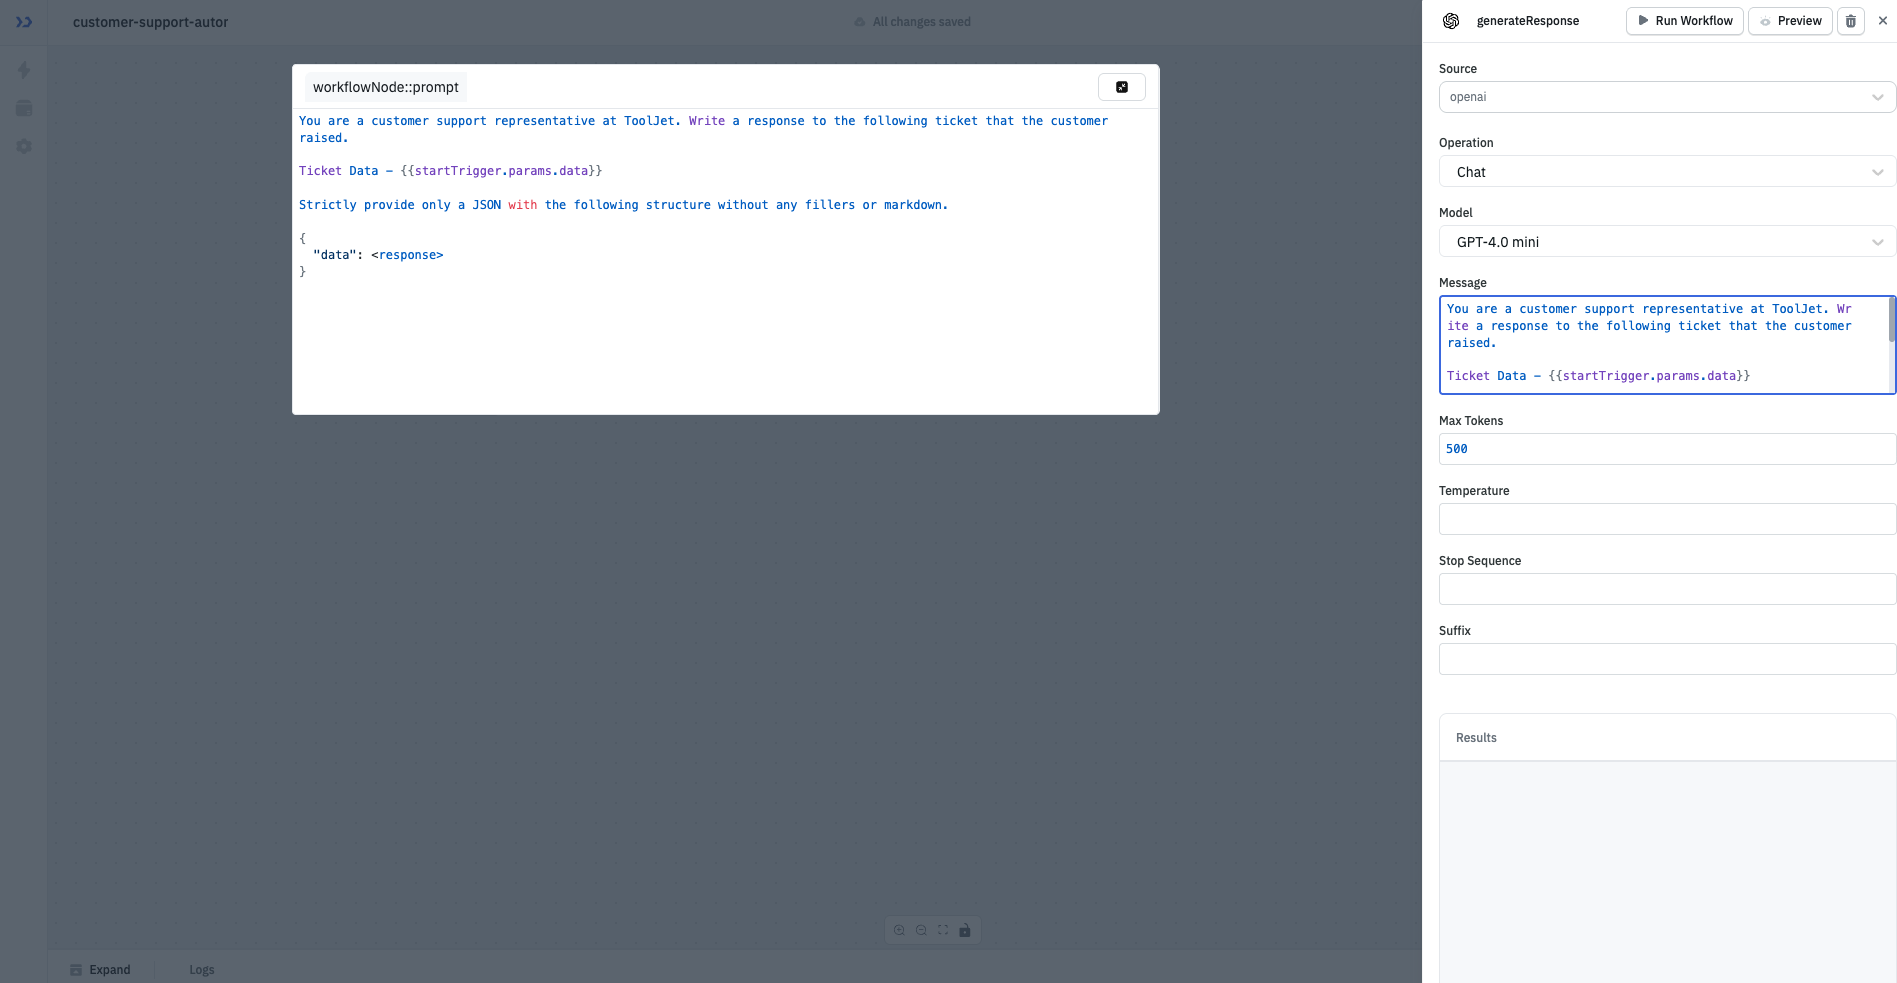
Step 1 : From the Trigger node, drag a connection and add an OpenAI data source node. Name this node generateResponse.
Step 2 : Select the Operation and Model and configure the prompt.
Example prompt:
You are a customer support representative at ToolJet. Write a response to the following ticket that the customer raised.

Ticket Data - {{startTrigger.params.data}}

Strictly provide only a JSON with the following structure without any fillers or markdown.

{
  "data": <response>
}
Step 3 : Create a JavaScript node to sanitise the response. Paste the following code into the JavaScript node. This code sanitises the response by removing any backticks and forwards only the necessary data.
let openAIResponse = generateResponse.data;
openAIResponse = openAIResponse.replace("```json", "");
openAIResponse = openAIResponse.replace("```", "");

openAIResponse = JSON.parse(openAIResponse.trim());

return openAIResponse.data;
Step 4 : Mail the response back to the user.
Configure an SMTP node to send the response back to the user.
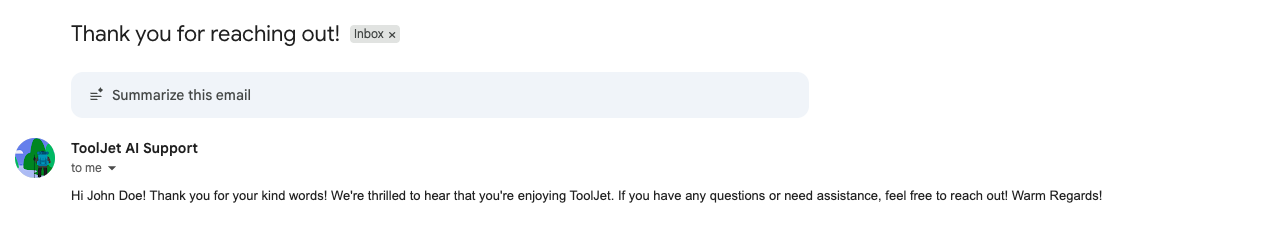
Result
Now whenever we trigger the workflow with a support ticket, the customer will receive an automated AI response.
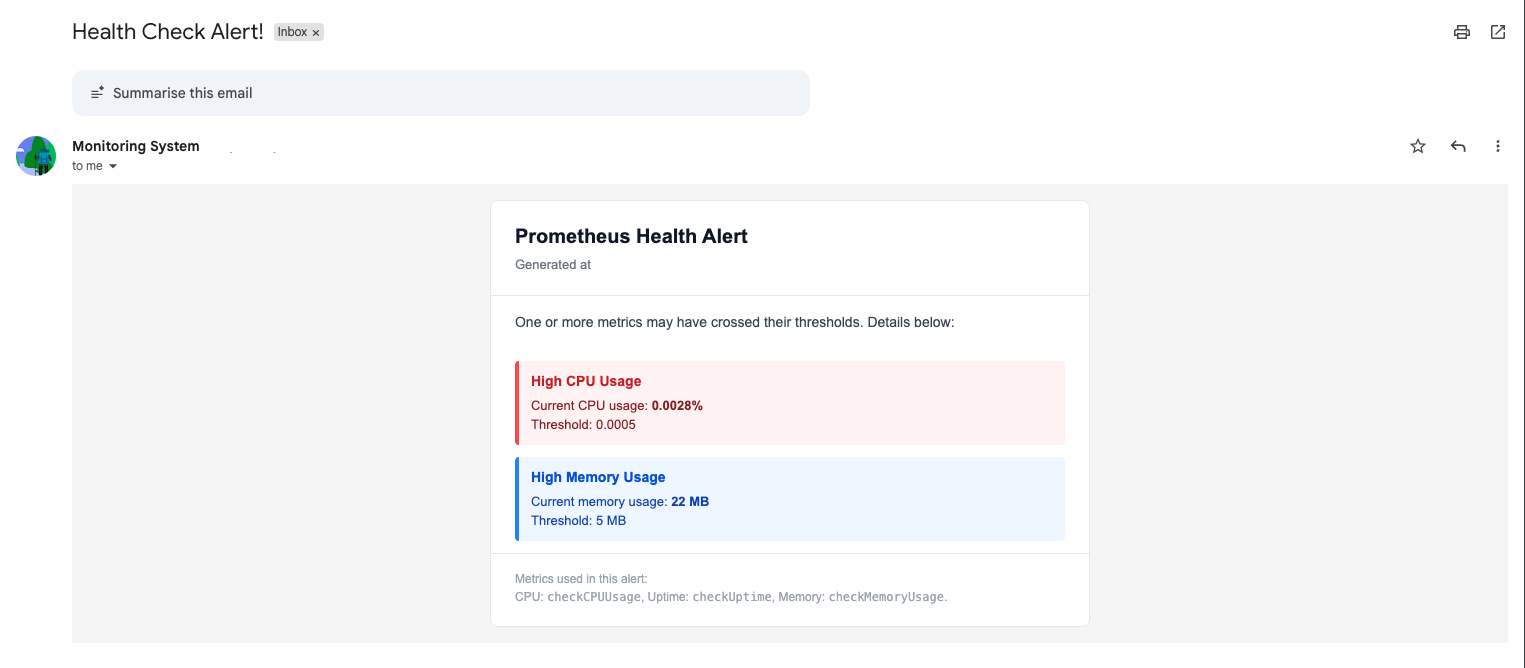
Example 2 - System Health Check Alerts using Prometheus
Consider a workflow that queries a Prometheus server every 30 mins for a health check and emails the DevOps team if the system is unhealthy.
To make our workflow run, we have kept the metrics for an unhealthy system as follows:
CPU Usage > 0.0005%
Up Time < 95%
Memory Usage > 5MB
These thresholds are intentionally low so the demo can easily show an alert.
Here's an overview of the workflow:
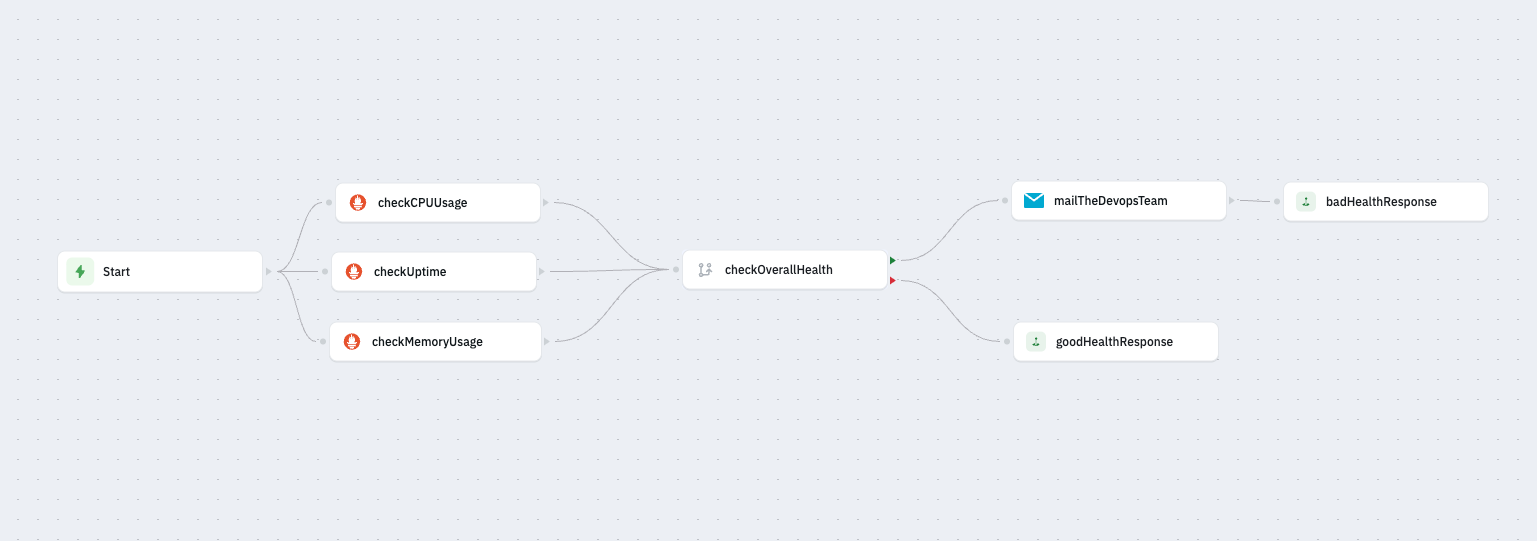
Step - 1 : Create a new workflow with a scheduled trigger that runs every 30 minutes into the hour.
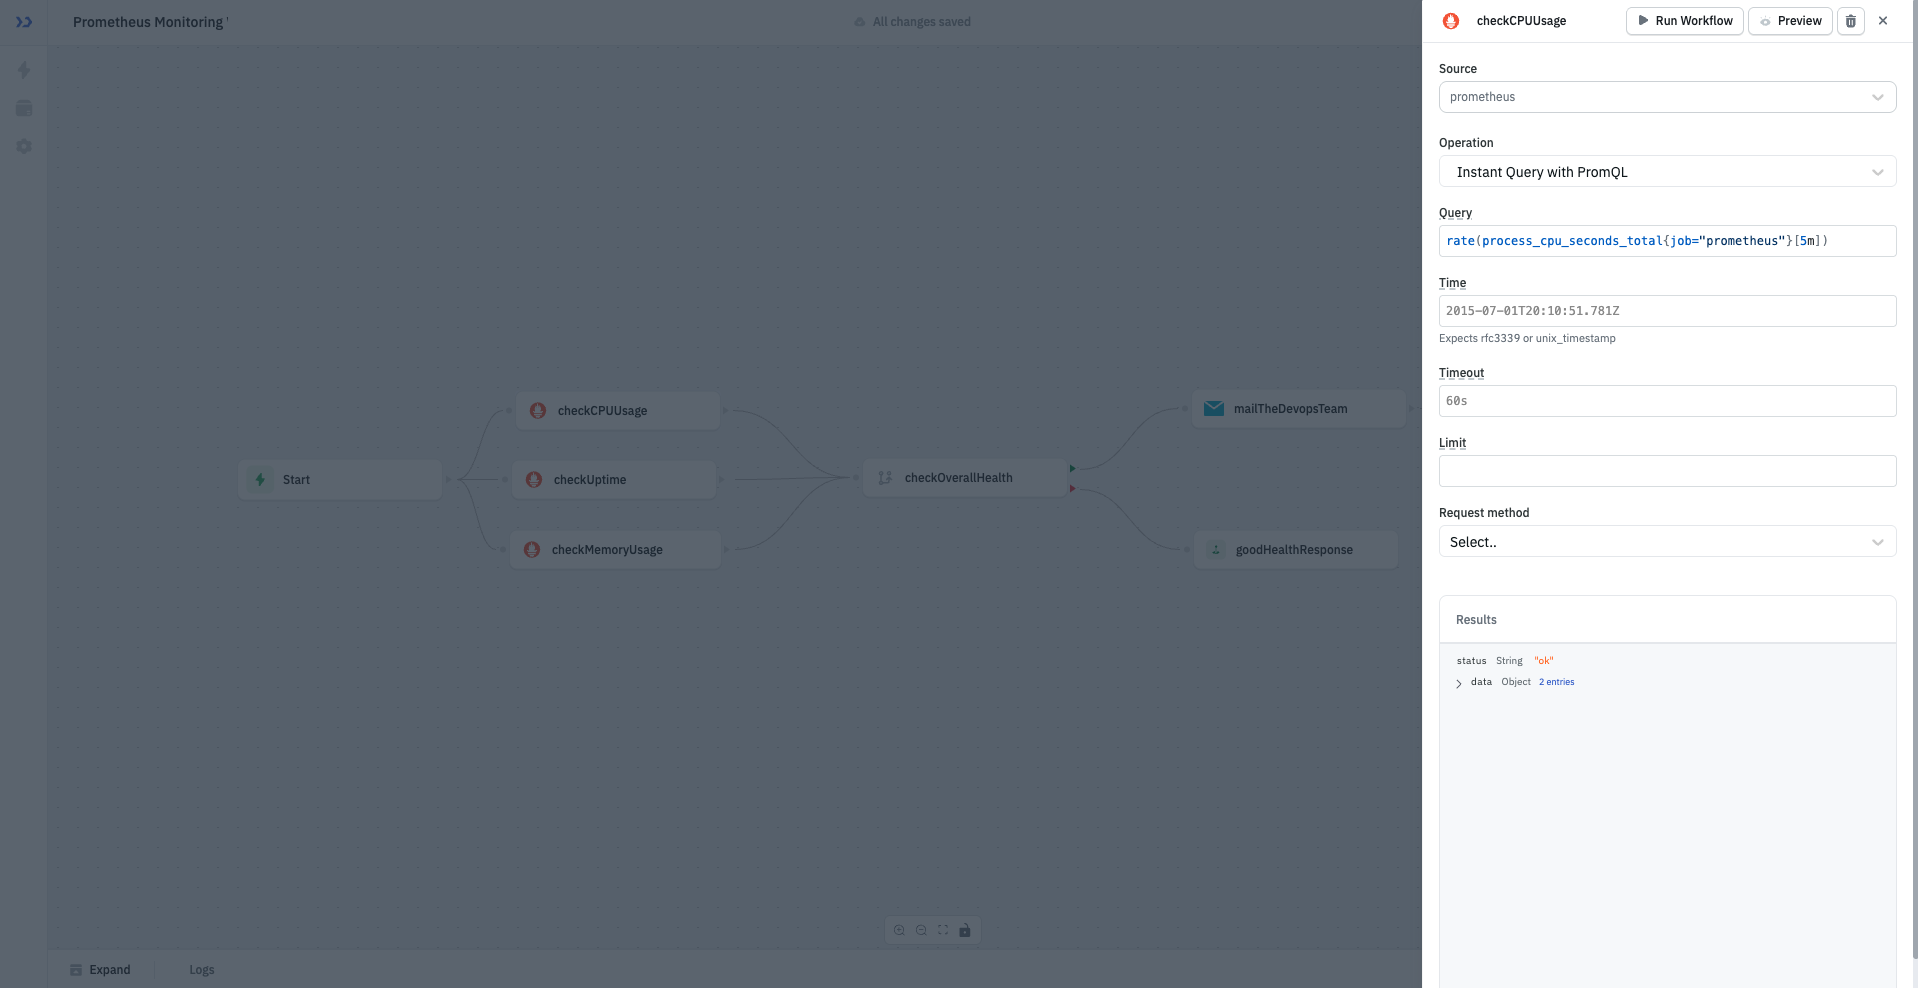
Step - 2 : Add three outgoing prometheus data source nodes.
We'll name these nodes as - checkCPUUsage, checkUptime, checkMemoryUsage and perform an Instant Query with PromQL operation.
To query the statistics, we'll add the following queries respectively:
-
checkCPUUsageNode:rate(process_cpu_seconds_total{job="prometheus"}[5m]) -
checkUptimeNode:avg_over_time(up{job="prometheus"}[1h]) * 100 -
checkMemoryUsageNode:go_memstats_alloc_bytes{job="prometheus"} / 1024 / 1024
Step - 3 : Add an If condition node to check health status named checkOverallHealth.
Prometheus returns results in a nested format. To get the actual metric value, we access:
<node>.data.data.result[0].value[1]. This is the numeric value we compare in the If condition.
We'll add the following condition to check if the system is healthy:
checkCPUUsage.data.data.result[0].value[1] > 0.0005 ||
  checkUptime.data.data.result[0].value[1] < 95 ||
  checkMemoryUsage.data.data.result[0].value[1] > 5;
If this evaluates to true, it means the system is unhealthy, else the system is healthy.
Step - 4 : Configure the SMTP Node
Create an outgoing SMTP node from the green port of checkOverallHealth and configure the node.
At minimum, fill the following fields:
- From address: The email you want alerts to come from
- From Name: A friendly label (e.g., Monitoring System)
- To/CC/BCC: Recipients of the alert
- Subject: Email subject (e.g., Health Check Alert!)
- HTML/Text: The email content you want to send
To learn more about configuring an SMTP data source, refer this documentation.
Output :
After running the workflow, we get the following email: