Observability Overview
ToolJet supports OpenTelemetry (OTEL) for comprehensive observability, enabling you to monitor application performance, track query executions, and analyze the health of ToolJet services and infrastructure through metrics. OpenTelemetry provides a standardized, vendor-agnostic way to collect observability data, allowing ToolJet to integrate with any OTEL-compatible third-party monitoring tool such as Datadog, New Relic, and Grafana.
Categories of Metrics
-
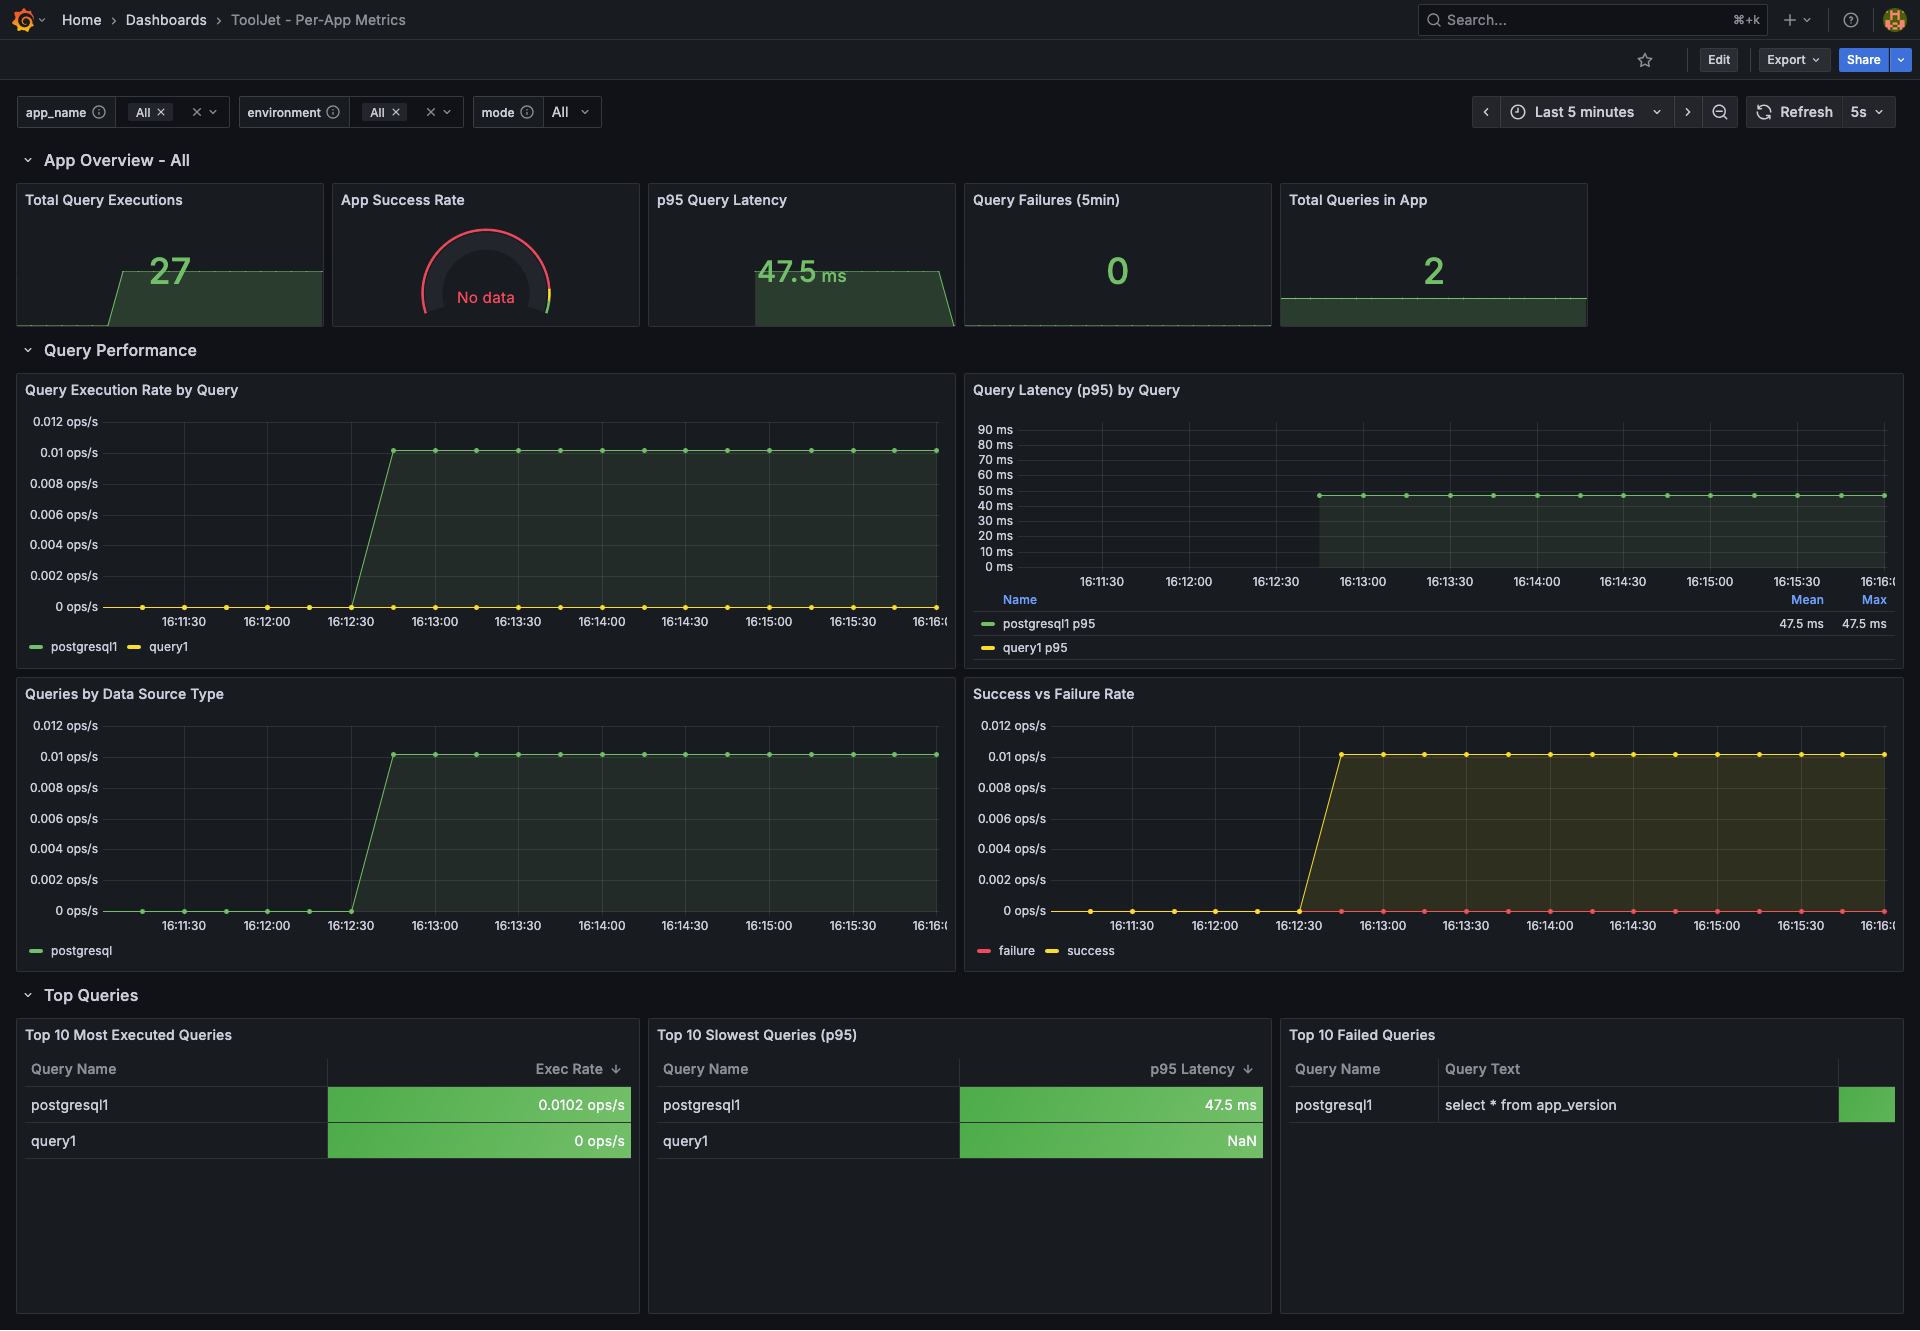
App-Based Metrics - Monitor the performance and reliability of individual ToolJet applications. These metrics include detailed labels such as
app_name,query_name,environment,query_text, andquery_mode(SQL/GUI) for fine-grained analysis.- Query Executions: Track total query executions per application
- Query Duration: Measure query execution times with histogram buckets
- Query Failures: Monitor failed queries with error categorization
- Success Rates: Application-level success rate percentages
- App Usage: Track application access and interaction events
-
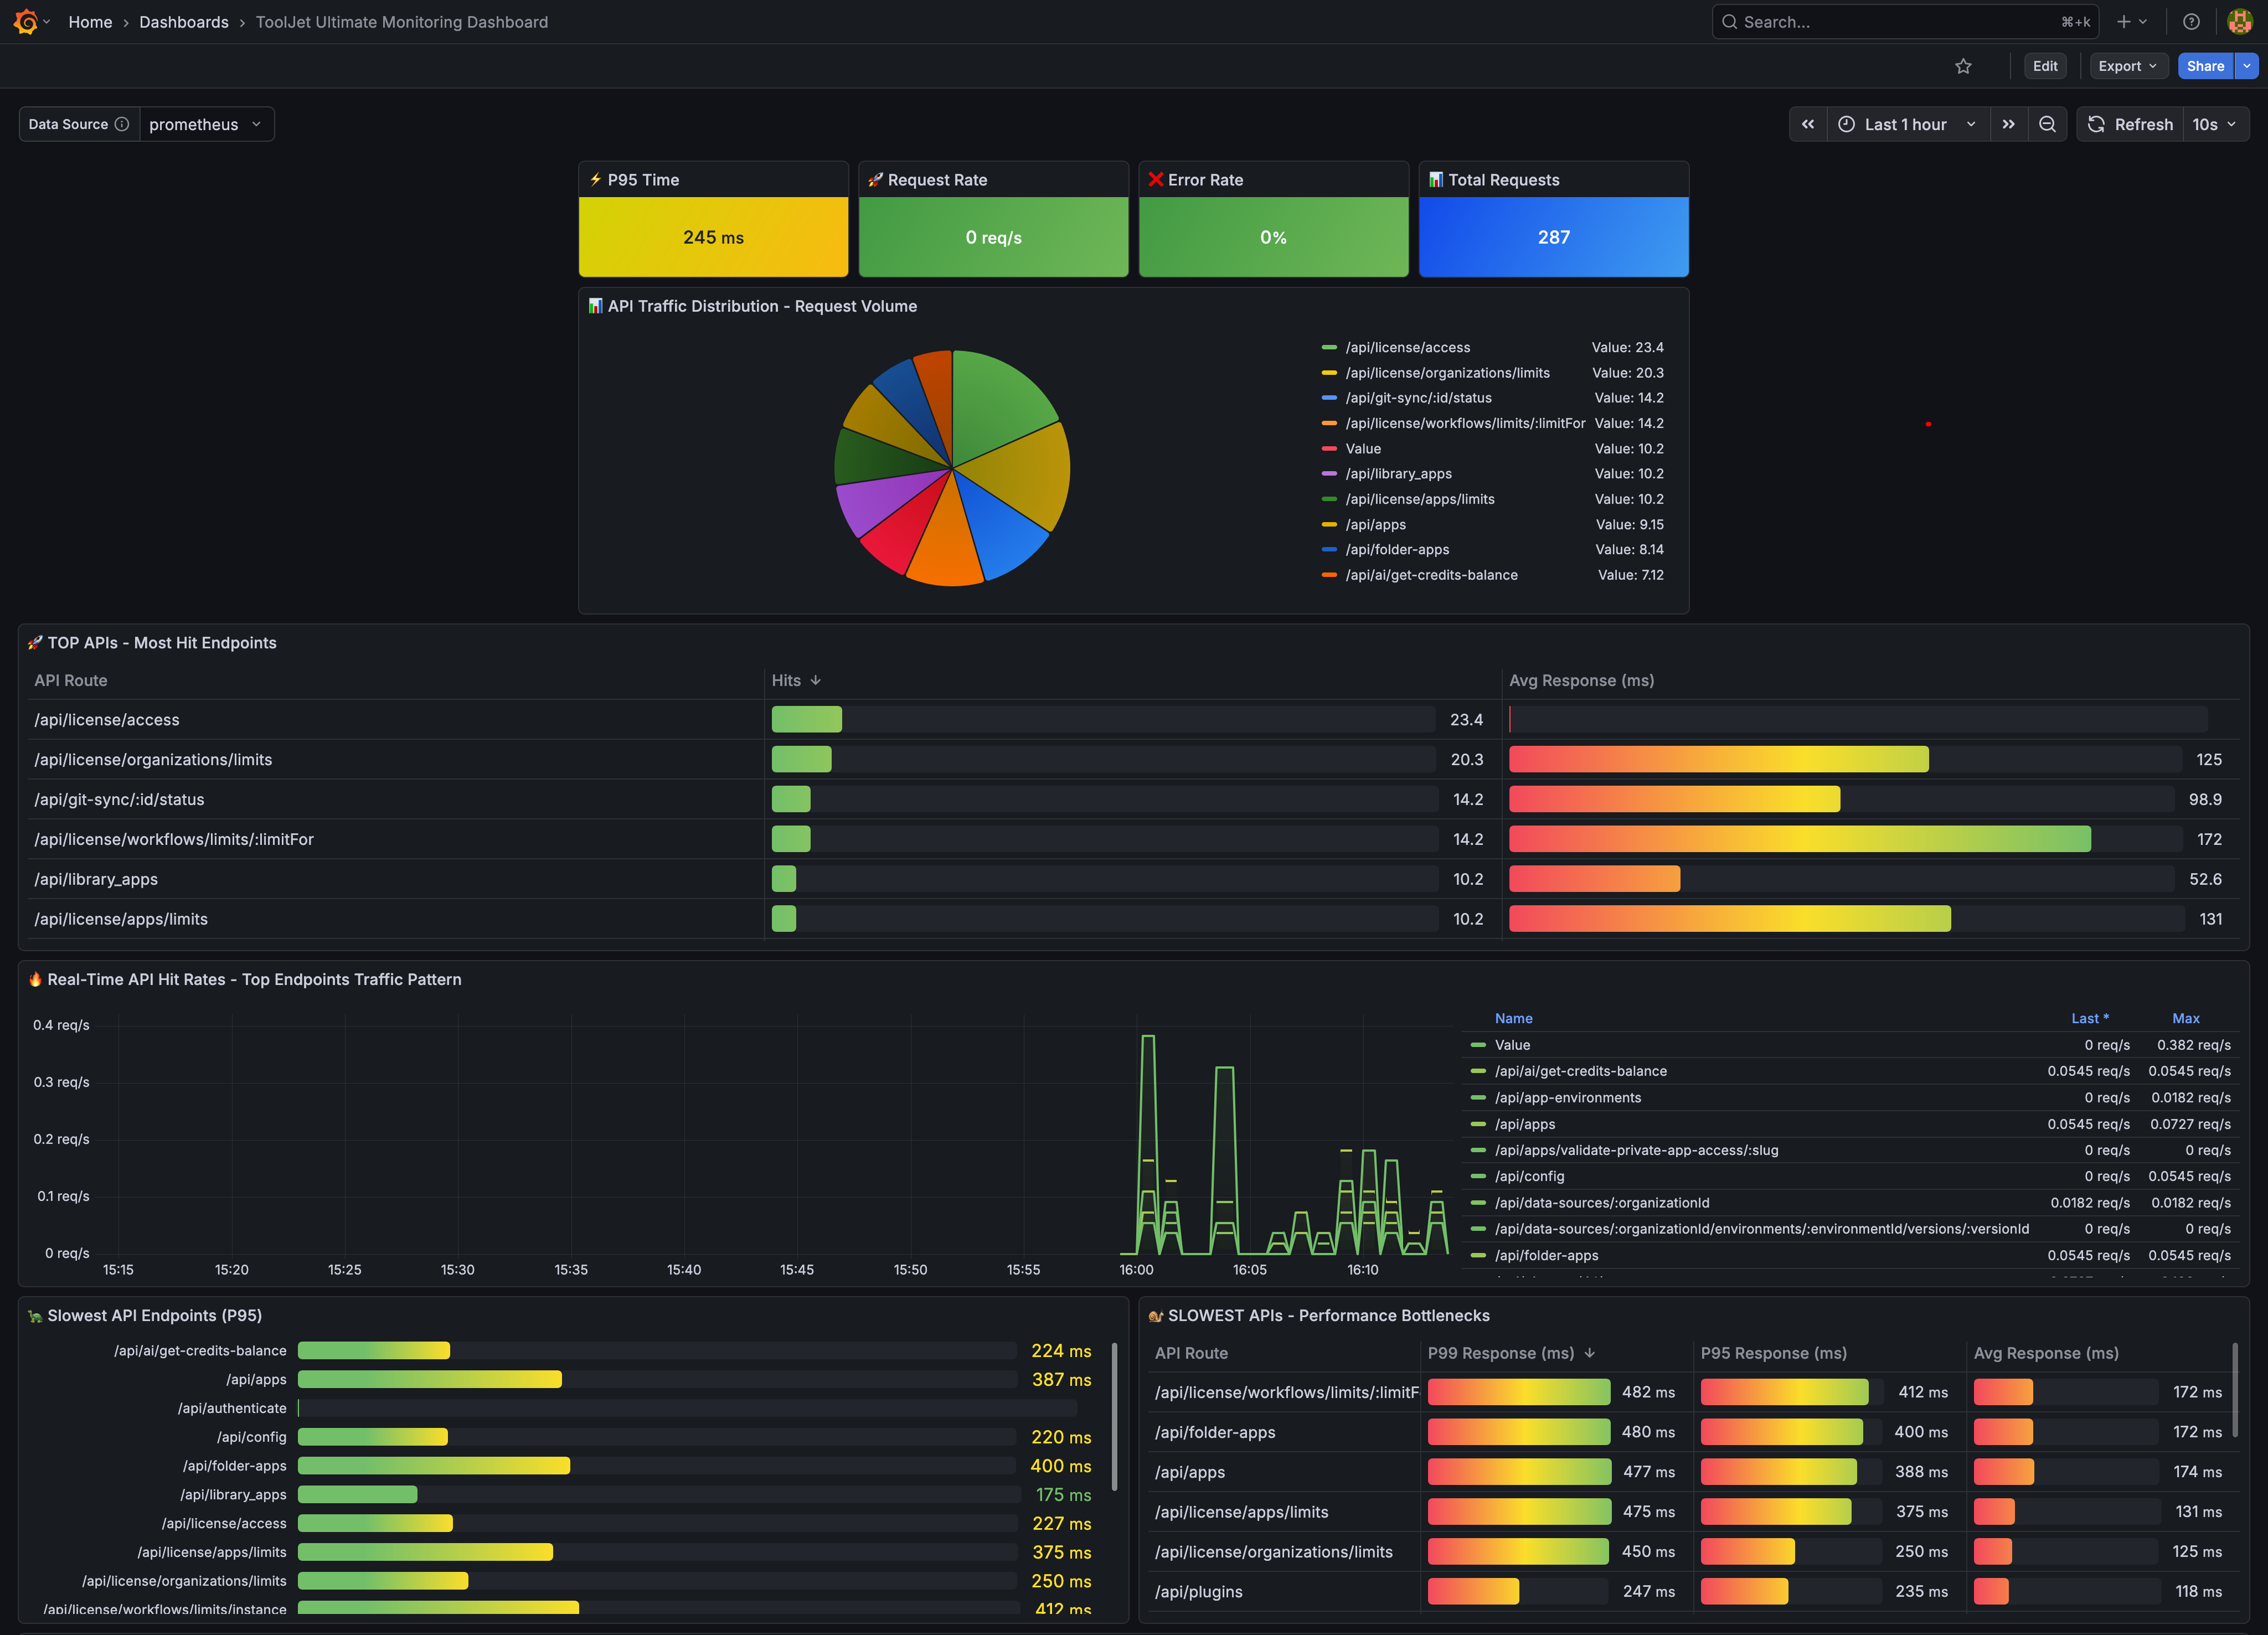
Platform-Based Metrics - Monitor the overall health and performance of your ToolJet instance:
- HTTP Server Metrics: Request rates, response times, status codes
- API Performance: Endpoint-specific latency and throughput
- Database Operations: Query execution times and connection health
- Node.js Runtime: Event loop delays, garbage collection, memory usage
- V8 Memory: Heap usage and external memory tracking
Configuration
Enable OpenTelemetry by setting the following environment variables in your ToolJet deployment:
Required Variables
# Enable OpenTelemetry metrics collection
ENABLE_OTEL=true

# OTLP Endpoint Configuration
OTEL_EXPORTER_OTLP_TRACES=http://localhost:4318/v1/traces
OTEL_EXPORTER_OTLP_METRICS=http://localhost:4318/v1/metrics

# Service Identification
OTEL_SERVICE_NAME=tooljet
Optional Variables
# Authentication (if required by your OTEL collector)
OTEL_HEADER=<your-api-key>

# Advanced Configuration
OTEL_LOG_LEVEL=debug                          # Enable debug logging for OTEL
OTEL_ACTIVE_USER_WINDOW_MINUTES=5             # Activity window for concurrent user tracking (default: 5)
OTEL_MAX_TRACKED_USERS=10000                  # Maximum tracked users/sessions (default: 10000)

# WARNING: High Cardinality - Only enable for debugging
OTEL_INCLUDE_QUERY_TEXT=false                 # Include actual query text in metrics (default: false)
                                              # Creates HIGH CARDINALITY - use OTEL Collector to drop in production
For a complete list of OpenTelemetry environment variables, refer to the OpenTelemetry documentation.
Setup Local OTEL Collector
Some observability platforms require an OpenTelemetry Collector as an intermediary. In such cases, you can deploy the Collector alongside ToolJet. ToolJet sends telemetry data to the Collector, which then forwards it to your observability platform based on its configuration.
This Docker Compose configuration can be used to deploy an OpenTelemetry Collector alongside ToolJet.
# docker-compose.yml excerpt
otel-collector:
  image: otel/opentelemetry-collector-contrib:latest
  command: ["--config=/etc/otel-collector-config.yaml"]
  volumes:
    - ./otel-collector-config.yaml:/etc/otel-collector-config.yaml
  ports:
    - "4318:4318"     # OTLP HTTP receiver
    - "8889:8889"     # Prometheus exporter
Production Considerations
High Cardinality Warning
The app-based metrics can optionally include a query_text label that contains the actual SQL or query content. By default, this is disabled to prevent high cardinality issues.
Enabling Query Text (For Debugging Only)
To enable query text in metrics for debugging purposes:
OTEL_INCLUDE_QUERY_TEXT=true
Enabling query_text creates high cardinality time series that can significantly impact Prometheus storage and query performance. Only enable this temporarily for debugging specific query issues.
Production Best Practices
If you must enable query_text in production:
- Use an OTEL Collector to drop the label before metrics reach Prometheus:
# otel-collector-config.yaml
processors:
  attributes:
    actions:
      - key: query_text
        action: delete

service:
  pipelines:
    metrics:
      receivers: [otlp]
      processors: [attributes]
      exporters: [prometheus]
- Alternative: Hash the query text to reduce cardinality:
processors:
  transform:
    metric_statements:
      - context: datapoint
        statements:
          - set(attributes["query_text"], SHA256(attributes["query_text"]))
Performance Impact
OpenTelemetry metrics collection has minimal performance impact:
- Metric collection is asynchronous and non-blocking
- Histogram buckets are pre-configured for optimal performance
- Observable gauges (like success rates) are updated on a 15-minute interval
Sampling and Filtering
For high-volume deployments, consider:
- Filtering environments: Only collect metrics from production environments
- Sampling queries: Use OTEL Collector sampling for high-frequency queries
- Aggregation: Pre-aggregate metrics at the collector level before storage
Troubleshooting
Metrics Not Appearing
- Verify
ENABLE_OTEL=trueis set - Check OTEL collector endpoint is reachable:
curl http://localhost:4318/v1/metrics
curl http://localhost:4318/v1/traces - Review ToolJet server logs for OTEL connection errors
- Verify OTEL collector configuration and Prometheus scrape targets
High Memory Usage
If you experience high memory usage:
- Remove high-cardinality labels like
query_textusing OTEL Collector processors - Reduce histogram bucket counts if needed
- Implement metric filtering at the collector level
- Consider using remote write to offload storage
Missing Labels or Metrics
Ensure you're using ToolJet version 3.16.0-LTS or higher, which includes the full OTEL implementation with both app-based and platform-based metrics.