New Relic
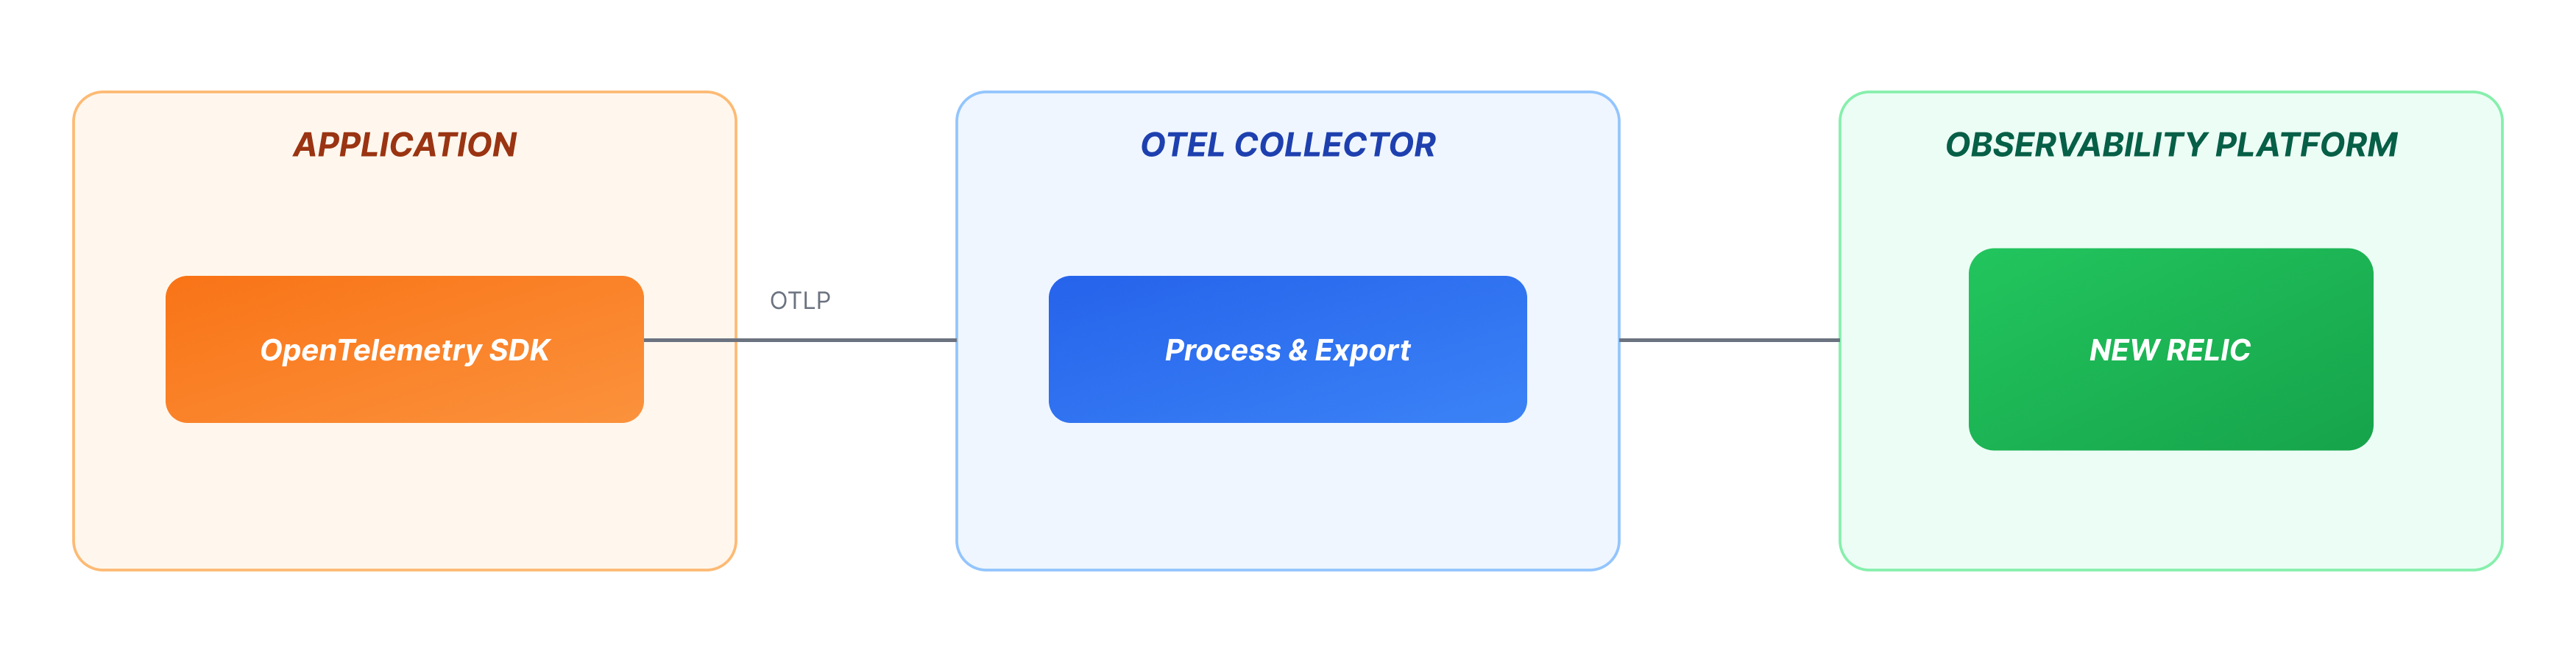
ToolJet supports OpenTelemetry (OTel) based observability. When using New Relic, ToolJet exports telemetry using OpenTelemetry to an OpenTelemetry Collector. The collector is responsible for forwarding this data to New Relic using New Relic’s OTLP-compatible ingestion APIs. This guide walks through setting up observability using New Relic.
ToolJet does not send telemetry data directly to New Relic. Instead, it uses OpenTelemetry to export traces and metrics to an OpenTelemetry Collector running in your environment. The collector then forwards this data to New Relic using New Relic’s OTLP ingestion endpoints.
The observability flow consists of three components:
-
ToolJet: Generates traces and metrics using OpenTelemetry.
-
OpenTelemetry Collector: Receives this telemetry locally and processes it.
-
New Relic: Ingests the processed telemetry and makes it available in APM and metrics views.
Setting Up Observability Using New Relic
Getting New Relic Licence Key
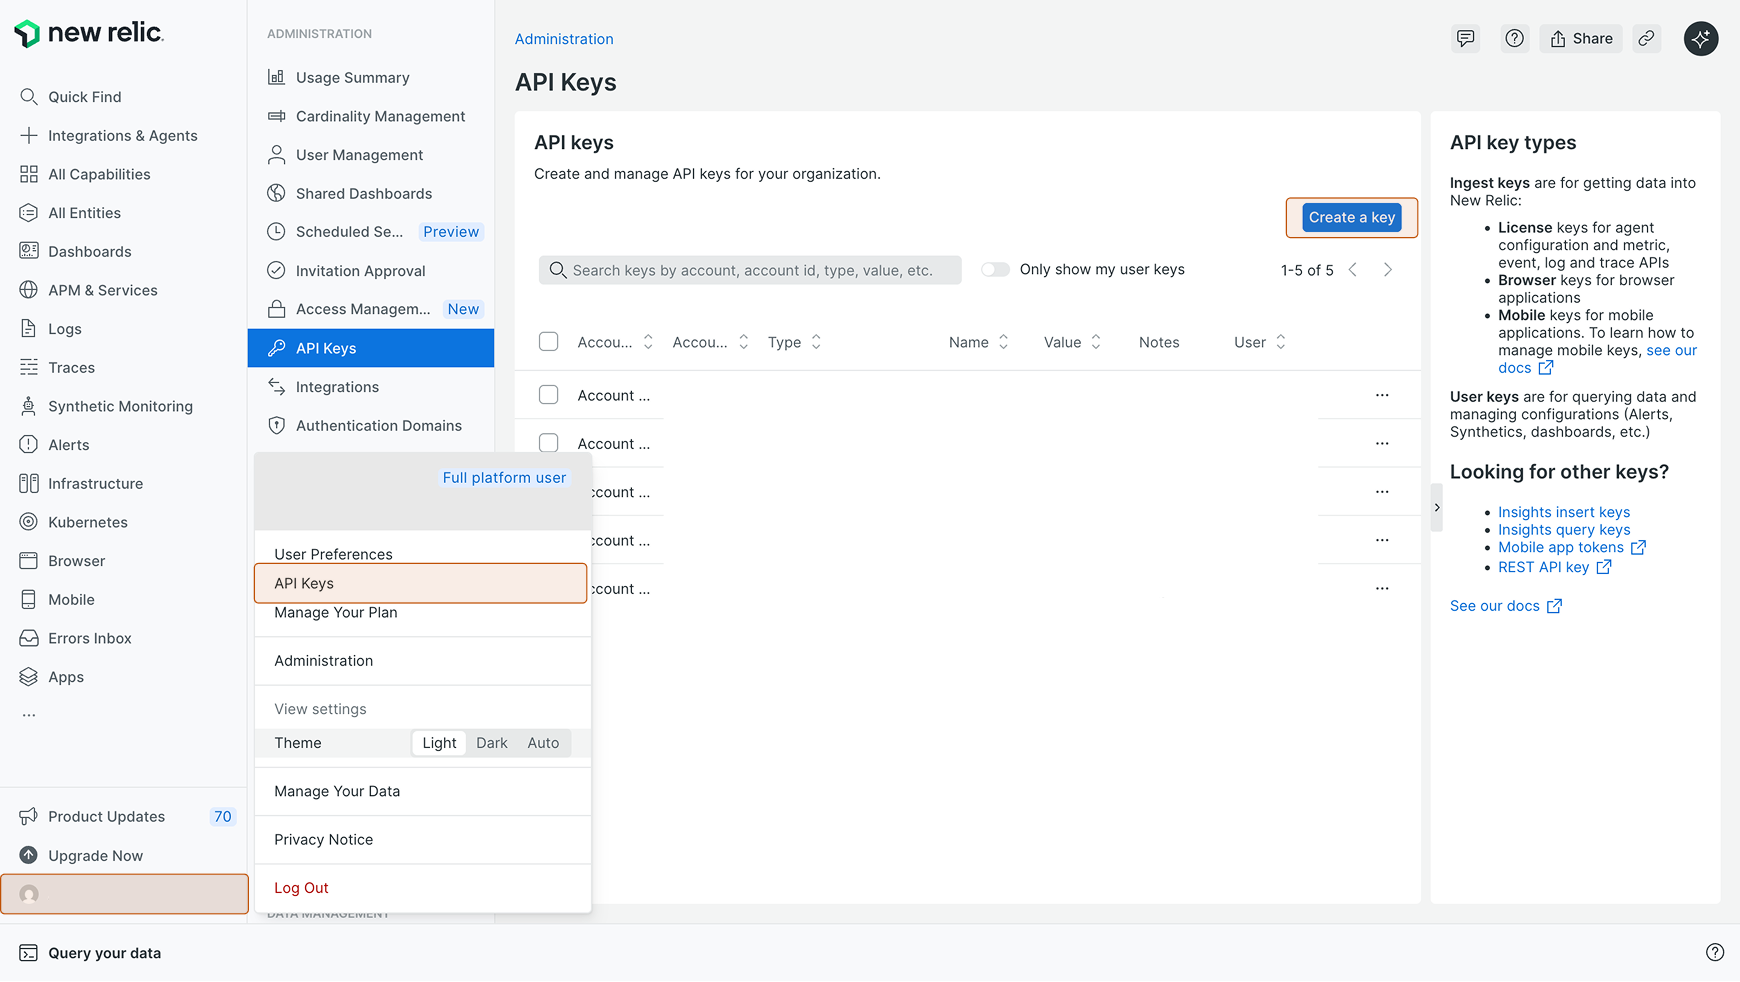
To obtain a New Relic Licence Key:
- Log in to New Relic.
- Navigate to Your Profile > API Keys
- Click Create a Key.
- Create a new key with the Key type set to: Ingest - Licence. Save the key for future use.
Step 1: Set Up an OpenTelemetry Collector
Use the following configuration file to run an OpenTelemetry Collector that forwards telemetry data to New Relic:
// otel-collector-config.yml
receivers:
  otlp:
    protocols:
      grpc:
        endpoint: 0.0.0.0:4317
      http:
        endpoint: 0.0.0.0:4318
        include_metadata: true

processors:
  batch:

exporters:
  otlphttp/newrelic:
    endpoint: <new_relic-endpoint>:4318
    headers:
      api-key: <your-new_relic-licence-key>

extensions:
  health_check:
  pprof:
    endpoint: :1888
  zpages:
    endpoint: :55679


service:
  pipelines:
    traces:
      receivers: [otlp]
      processors: [batch]
      exporters: [otlphttp/newrelic]

    metrics:
      receivers: [otlp]
      processors: [batch]
      exporters: [otlphttp/newrelic]
New Relic OTLP Endpoints
Use the endpoint that matches your New Relic region:
US region: https://otlp.nr-data.net
EU region: https://otlp.eu01.nr-data.net
For example: https://otlp.nr-data.net:4318
Refer to the official New Relic documentation for region-specific endpoint details.
Step 2: Run the OpenTelemetry Collector
Add the following service to your ToolJet Docker Compose file to run the OpenTelemetry Collector:
  otel-collector:
    image: otel/opentelemetry-collector-contrib:latest
    container_name: otel-collector
    command: ["--config=/etc/otel-collector-config.yml"]
    volumes:
      - ./otel-collector-config.yml:/etc/otel-collector-config.yml
    ports:
      - "4317:4317"
      - "4318:4318"
      - "8889:8889"
If you are not running ToolJet using Docker or Docker Compose, you can host the OpenTelemetry Collector independently and configure ToolJet to point to the collector’s endpoint.
Step 3: Configure Environment Variables in ToolJet
Set up the following environment variables in the .env file while running ToolJet:
ENABLE_OTEL=true
OTEL_SERVICE_NAME=tooljet

# OTel Collector endpoints
OTEL_EXPORTER_OTLP_TRACES=http://otel-collector:4318/v1/traces
OTEL_EXPORTER_OTLP_METRICS=http://otel-collector:4318/v1/metrics

# Optional but useful while debugging
OTEL_LOG_LEVEL=debug
Your ToolJet instance will now begin streaming traces and metrics to New Relic, which can be viewed in New Relic APM.