Grafana
Grafana is an open-source observability and visualization platform for exploring metrics, traces, and logs. ToolJet integrates with Grafana using OpenTelemetry by exporting telemetry data to an OpenTelemetry Collector, which then forwards the data to Grafana-supported storage backends. This guide walks through setting up observability using Grafana.
ToolJet does not send telemetry data directly to Grafana. Instead, it uses OpenTelemetry to export traces and metrics to an OpenTelemetry Collector running in your environment. The collector then forwards this data to Grafana-supported storage backends.
The observability flow consists of the following components:
- ToolJet: Generates traces and metrics using OpenTelemetry.
- OpenTelemetry Collector: Receives and processes telemetry locally.
- Tempo: Stores distributed traces.
- Prometheus: Stores metrics.
- Grafana: Visualizes traces and metrics via dashboards and Explore views.
Setting Up Observability Using Grafana
Step 1: Set Up an OpenTelemetry Collector
Use the following configuration file to run an OpenTelemetry Collector that forwards telemetry data to Tempo and Prometheus.
# otel-collector-config.yml
receivers:
  otlp:
    protocols:
      grpc:
        endpoint: 0.0.0.0:4317
      http:
        endpoint: 0.0.0.0:4318
        include_metadata: true

processors:
  batch:

exporters:
  # Export traces to Tempo
  otlp/tempo:
    endpoint: tempo:4317
    tls:
      insecure: true

  # Export metrics for Prometheus to scrape
  prometheus:
    endpoint: "0.0.0.0:8889"

extensions:
  health_check:
  pprof:
    endpoint: :1888
  zpages:
    endpoint: :55679

service:
  extensions: [health_check, pprof, zpages]
  pipelines:
    traces:
      receivers: [otlp]
      processors: [batch]
      exporters: [otlp/tempo]

    metrics:
      receivers: [otlp]
      processors: [batch]
      exporters: [prometheus]
Step 2: Run the Observability Stack
Run the OpenTelemetry Collector along with Tempo, Prometheus, and Grafana by adding the following services to your docker-compose.yml.
OpenTelemetry Collector
otel-collector:
  image: otel/opentelemetry-collector-contrib:latest
  container_name: otel-collector
  command: ["--config=/etc/otel-collector-config.yml"]
  volumes:
    - ./otel-collector-config.yml:/etc/otel-collector-config.yml
  ports:
    - "4317:4317"
    - "4318:4318"
    - "8889:8889"
Tempo (Trace Storage)
tempo:
  image: grafana/tempo:latest
  container_name: tempo
  command: ["-config.file=/etc/tempo.yml"]
  ports:
    - "3200:3200"
  volumes:
    - ./tempo.yml:/etc/tempo.yml
Prometheus (Metrics Storage)
prometheus:
  image: prom/prometheus:latest
  container_name: prometheus
  ports:
    - "9090:9090"
  volumes:
    - ./prometheus.yml:/etc/prometheus/prometheus.yml
Grafana (Visualization)
grafana:
  image: grafana/grafana:latest
  container_name: grafana
  ports:
    - "3001:3000"
  environment:
    GF_SECURITY_ADMIN_USER: admin
    GF_SECURITY_ADMIN_PASSWORD: admin
    GF_USERS_ALLOW_SIGN_UP: "false"
  depends_on:
    - prometheus
    - tempo
Step 3: Configure Trace and Metrics Backends
These configuration files are mounted into their respective containers by Docker Compose. If you are running the services outside Docker, place these files according to your service manager or deployment setup.
Configure Tempo (Trace Storage)
Create a tempo.yml file with the following configuration:
server:
  http_listen_port: 3200

distributor:
  receivers:
    otlp:
      protocols:
        grpc:
        http:

storage:
  trace:
    backend: local
    local:
      path: /tmp/tempo
    wal:
      path: /tmp/tempo/wal
Configure Prometheus (Metrics Storage)
Create a prometheus.yml file with the following configuration:
global:
  scrape_interval: 15s

scrape_configs:
  - job_name: "otel-collector"
    static_configs:
      - targets: ["otel-collector:8889"]
Step 4: Configure Environment Variables in ToolJet
Set the following environment variables in the .env file used by ToolJet:
ENABLE_OTEL=true
OTEL_SERVICE_NAME=tooljet
OTEL_EXPORTER_OTLP_TRACES=http://otel-collector:4318/v1/traces
OTEL_EXPORTER_OTLP_METRICS=http://otel-collector:4318/v1/metrics

# Optional but useful while debugging
OTEL_LOG_LEVEL=debug
Step 5: Configure Data Sources in Grafana
Once Grafana is running, open http://localhost:3001 and log in using the admin credentials.
Navigate to Connections > Data Sources, then click Add data source. You’ll create two data sources: one for metrics (Prometheus) and one for traces (Tempo).
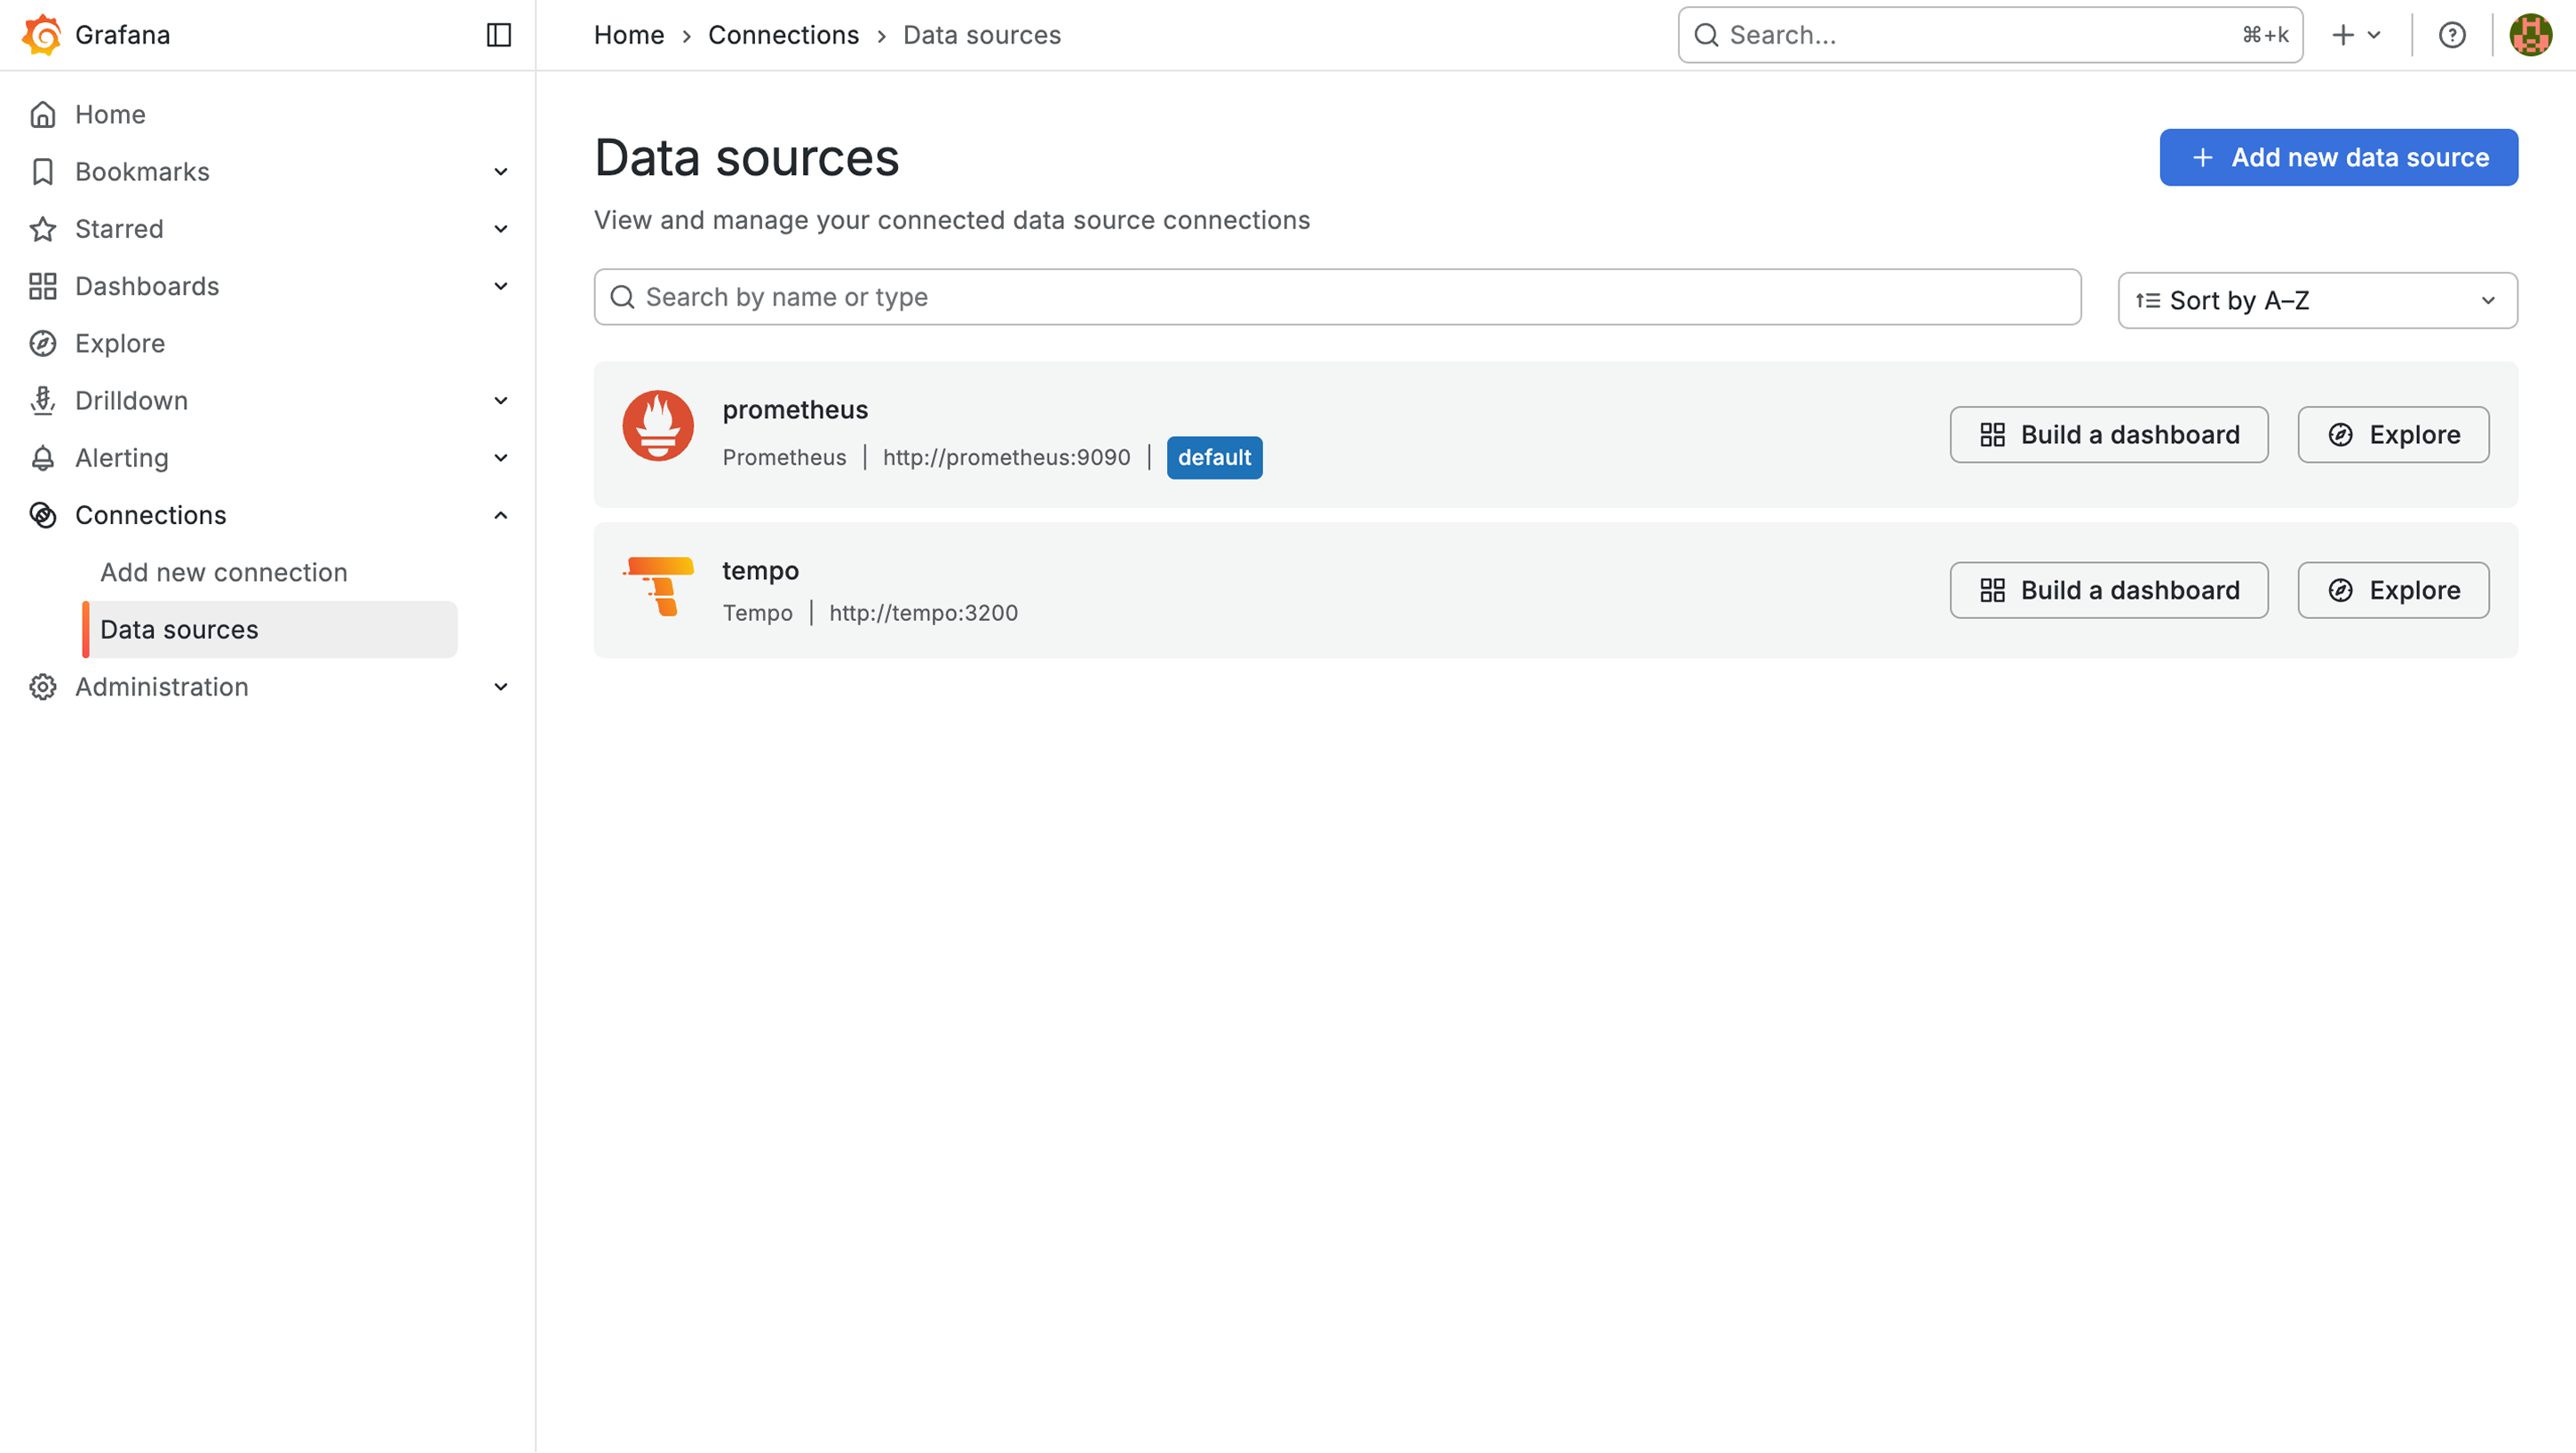
1. Prometheus (Metrics)
- In the Add data source page, search for Prometheus and select it.
- Under Connection, set the Prometheus server URL to:
http://prometheus:9090
- Click Save and test.
2. Tempo (Traces)
- Go back to Add data source, search for Tempo, and select it.
- Under Connection, set the URL to:
http://tempo:3200
- Click Save and test.
Your ToolJet instance will now begin streaming traces and metrics to Grafana.
Using ToolJet Grafana Dashboards
Once observability is set up, ToolJet provides two pre-built Grafana dashboards for visualizing metrics:
These dashboards require Prometheus (metrics) and Tempo (traces) to be configured as described above.
Per-App Metrics Dashboard
Download the dashboard:
curl -O https://tooljet-deployments.s3.us-west-1.amazonaws.com/tooljet-app-dashboard.json
This dashboard focuses on application-specific metrics and includes:
- App Overview: Total query executions, success rate gauge, p95 latency, failure counts
- Query Performance: Execution rates by query, latency percentiles, data source breakdown
- Top Queries: Most executed queries, slowest queries (p95), most failed queries
- Environment Filtering: Filter by app name, environment (production/staging/development), and mode (view/edit)
The dashboard automatically extracts query text and environment names for immediate debugging without consulting logs.
Platform Metrics Dashboard
Download the dashboard:
curl -O https://tooljet-deployments.s3.us-west-1.amazonaws.com/tooljet-platform-dashboard.json
This dashboard provides comprehensive platform monitoring:
- System Health: P95 response time, request rate, error rate, total requests
- API Analytics: Traffic distribution, top endpoints by hits, slowest endpoints
- Performance Trends: Multi-percentile response time analysis (P50, P95, P99)
- Status Codes: Success/error distribution over time
- Database Performance: Query execution times, connection health
- Runtime Metrics: Node.js event loop, GC performance, V8 memory usage
- Distributed Tracing: Integration with Jaeger for trace viewing
Importing Dashboards
To import the Grafana dashboards:
- Download the dashboard JSON files:
# Download App-Based Metrics Dashboard
curl -O https://tooljet-deployments.s3.us-west-1.amazonaws.com/tooljet-app-dashboard.json

# Download Platform-Based Metrics Dashboard
curl -O https://tooljet-deployments.s3.us-west-1.amazonaws.com/tooljet-platform-dashboard.json - Open Grafana and navigate to Dashboards > Import
- Click Upload JSON file and select the downloaded dashboard JSON file
- Select your Prometheus data source
- Click Import
The dashboards will be immediately available with real-time data from your ToolJet instance.