Conditional Formatting in Table
Conditional formatting enhances the visual representation of data by allowing you to dynamically adjust the appearance of cells in Table component based on specific conditions. This how-to guide will guide you through the process of implementing advanced conditional formatting for text color and background color in a Table component.
Create a New Application and Set Up Data Source
-
Create a new application and add a Table component to the canvas.
-
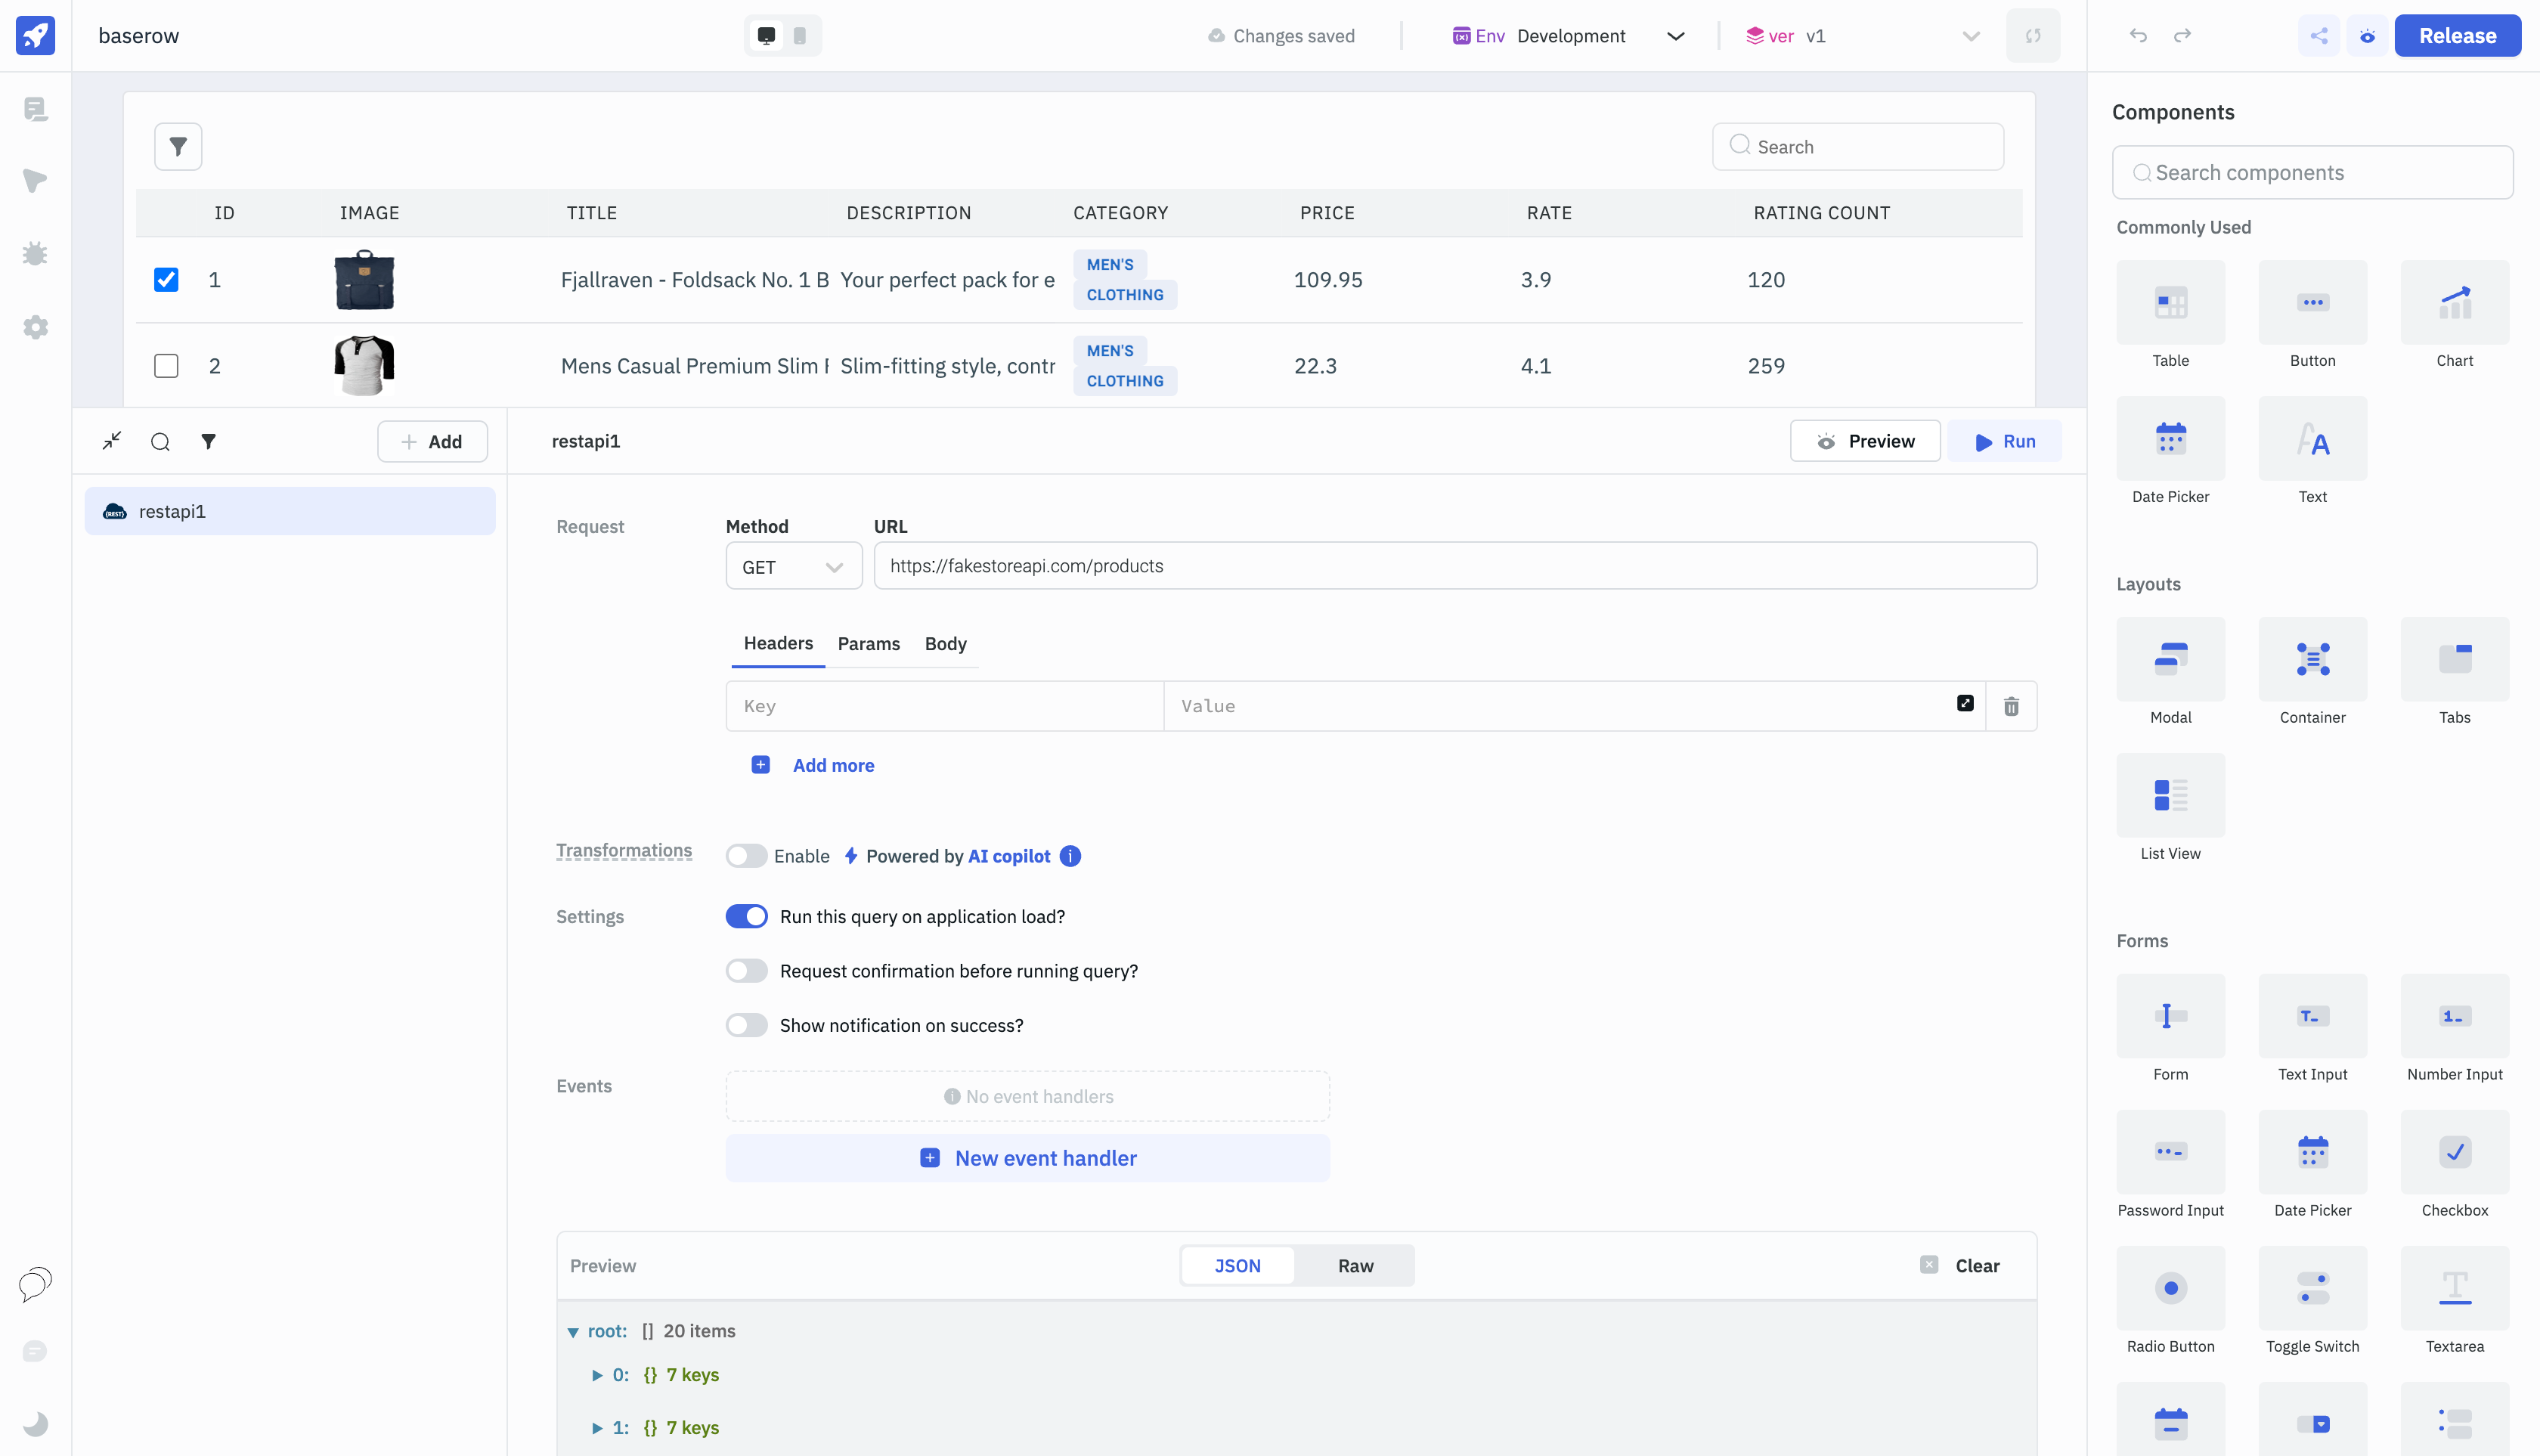
Open the Query Panel at the bottom and click on the + Add button.
-
Choose REST API as your data source and set the method to GET.
-
Enter the following URL as REST API endpoint:
https://fakestoreapi.com/products
- Click on the Preview button to view the data. Execute the query by clicking on the Run button.
Display Data on the Table
-
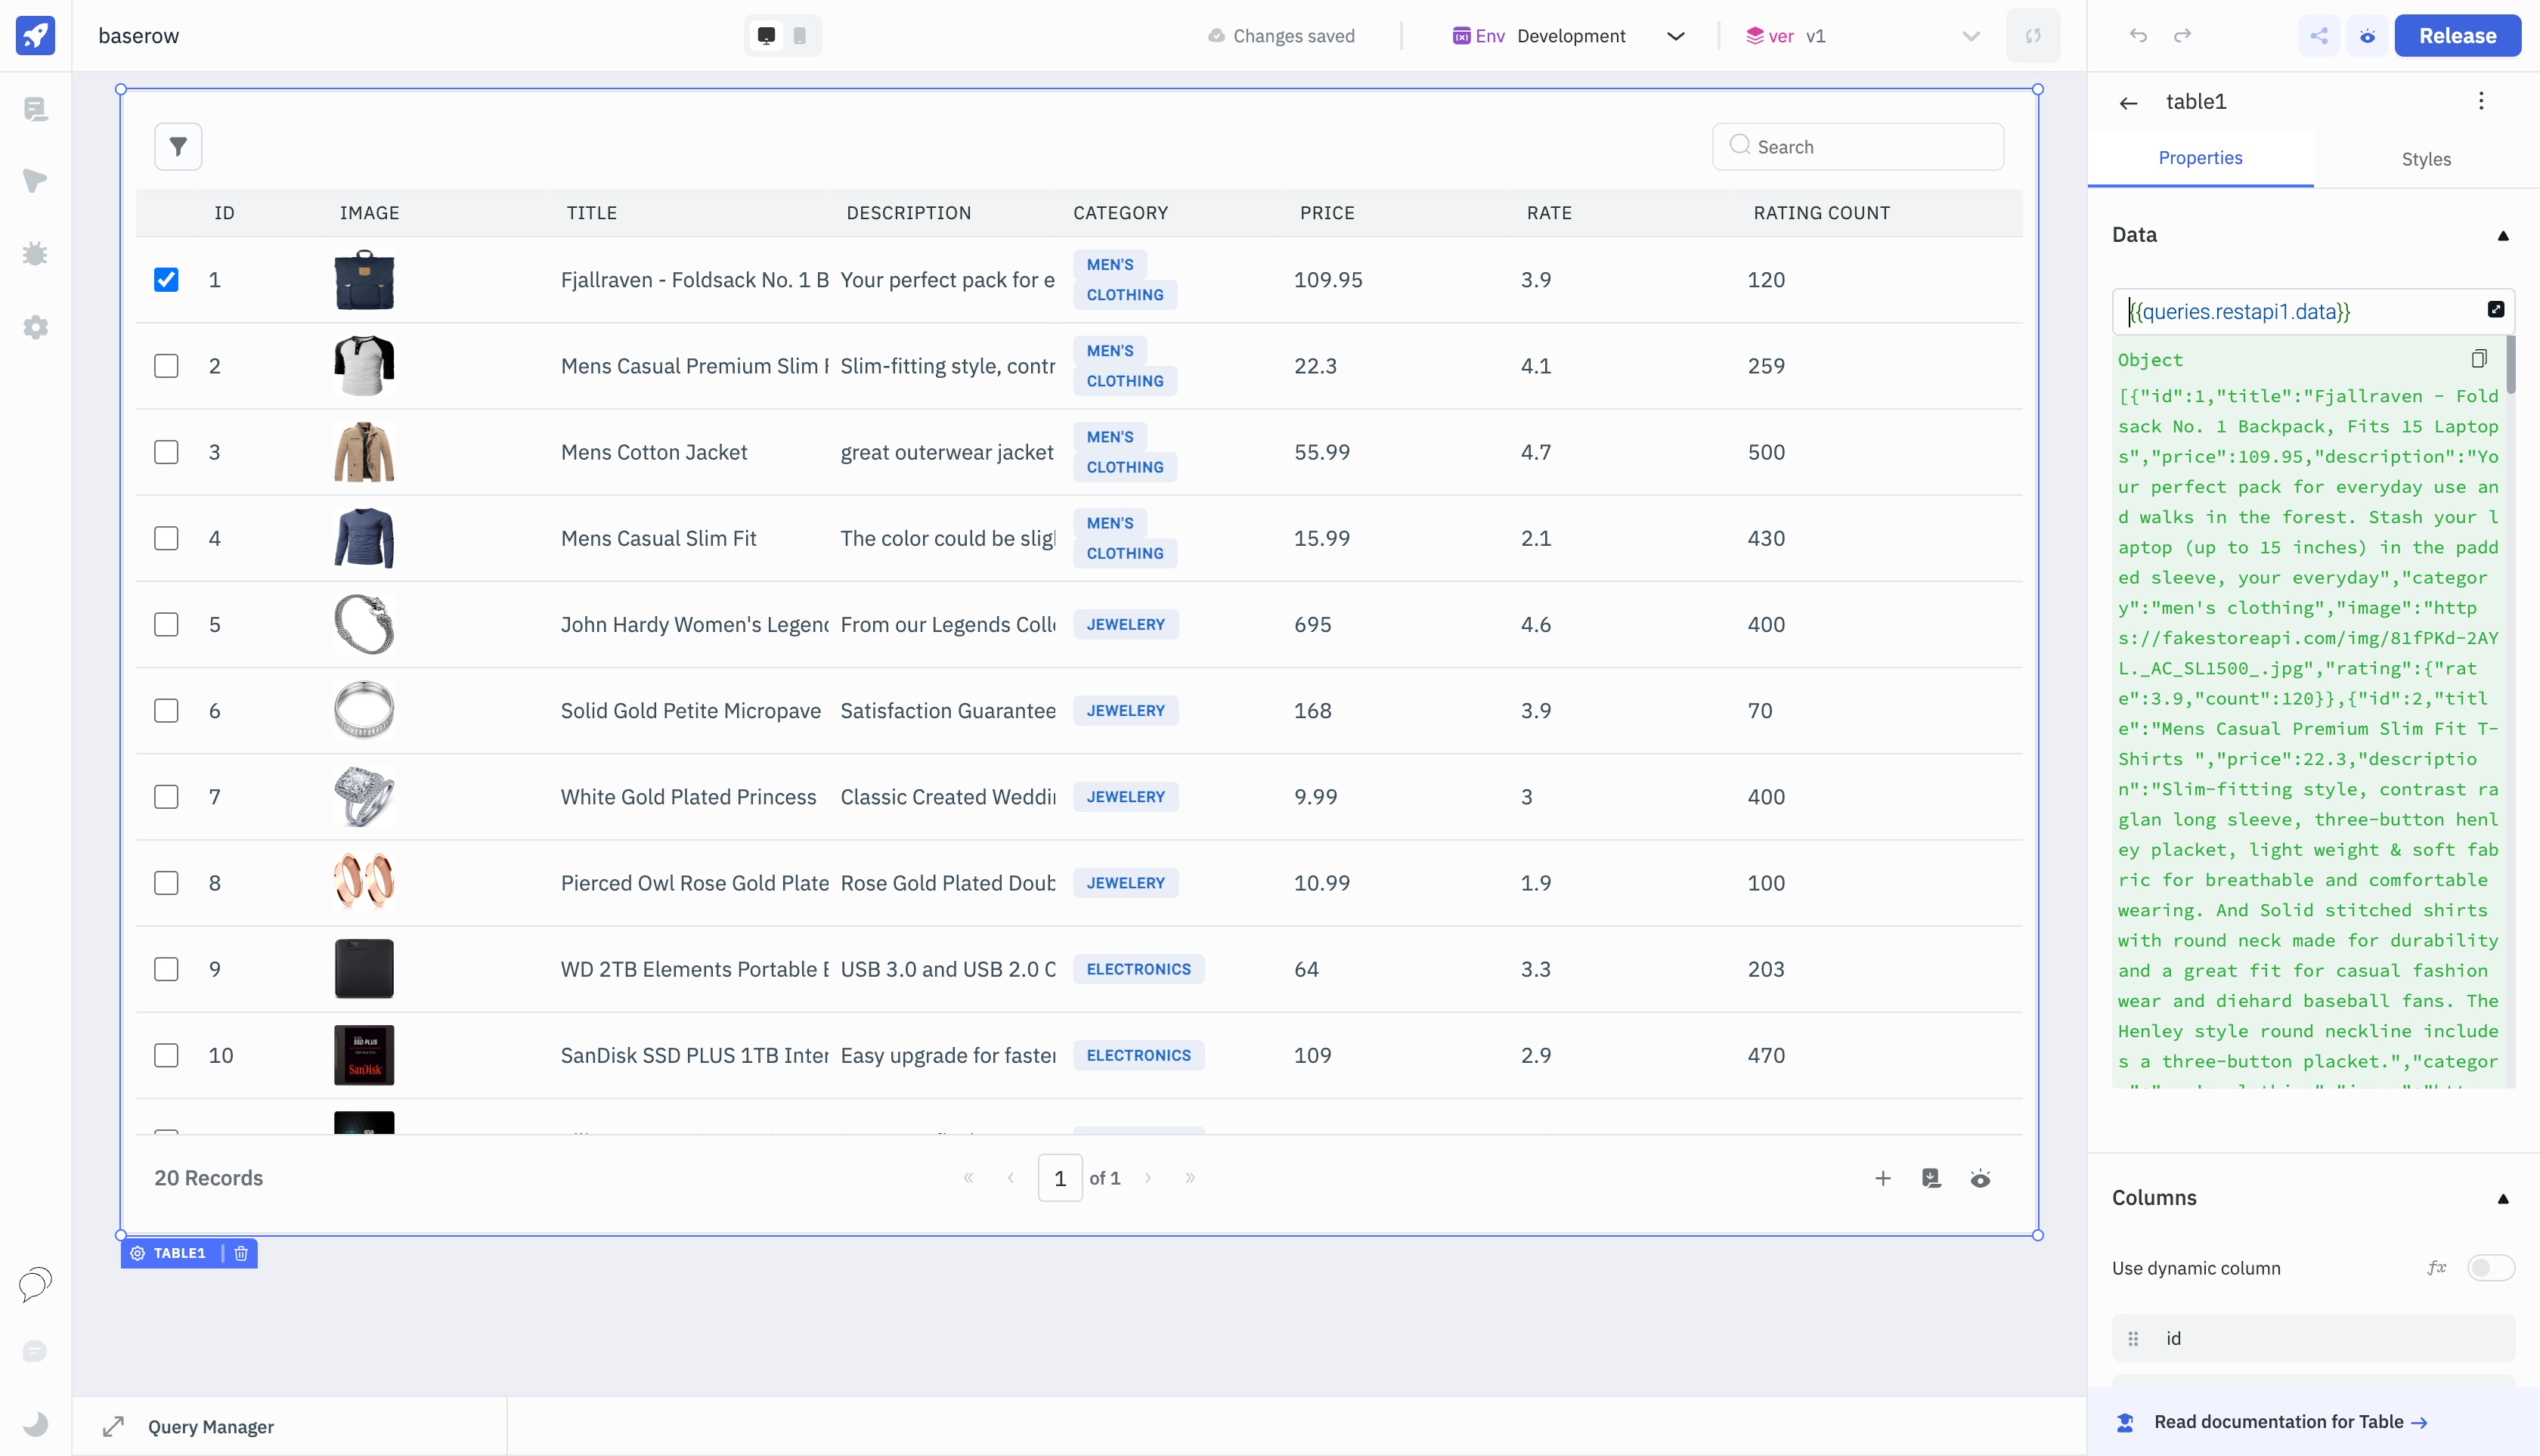
Hide the Query Panel and click on the Table component to open its properties panel.
-
Under the
Dataproperty, enter the following code:
{{queries.restapi1.data}}
Enabling Conditional Formatting
-
Go to the
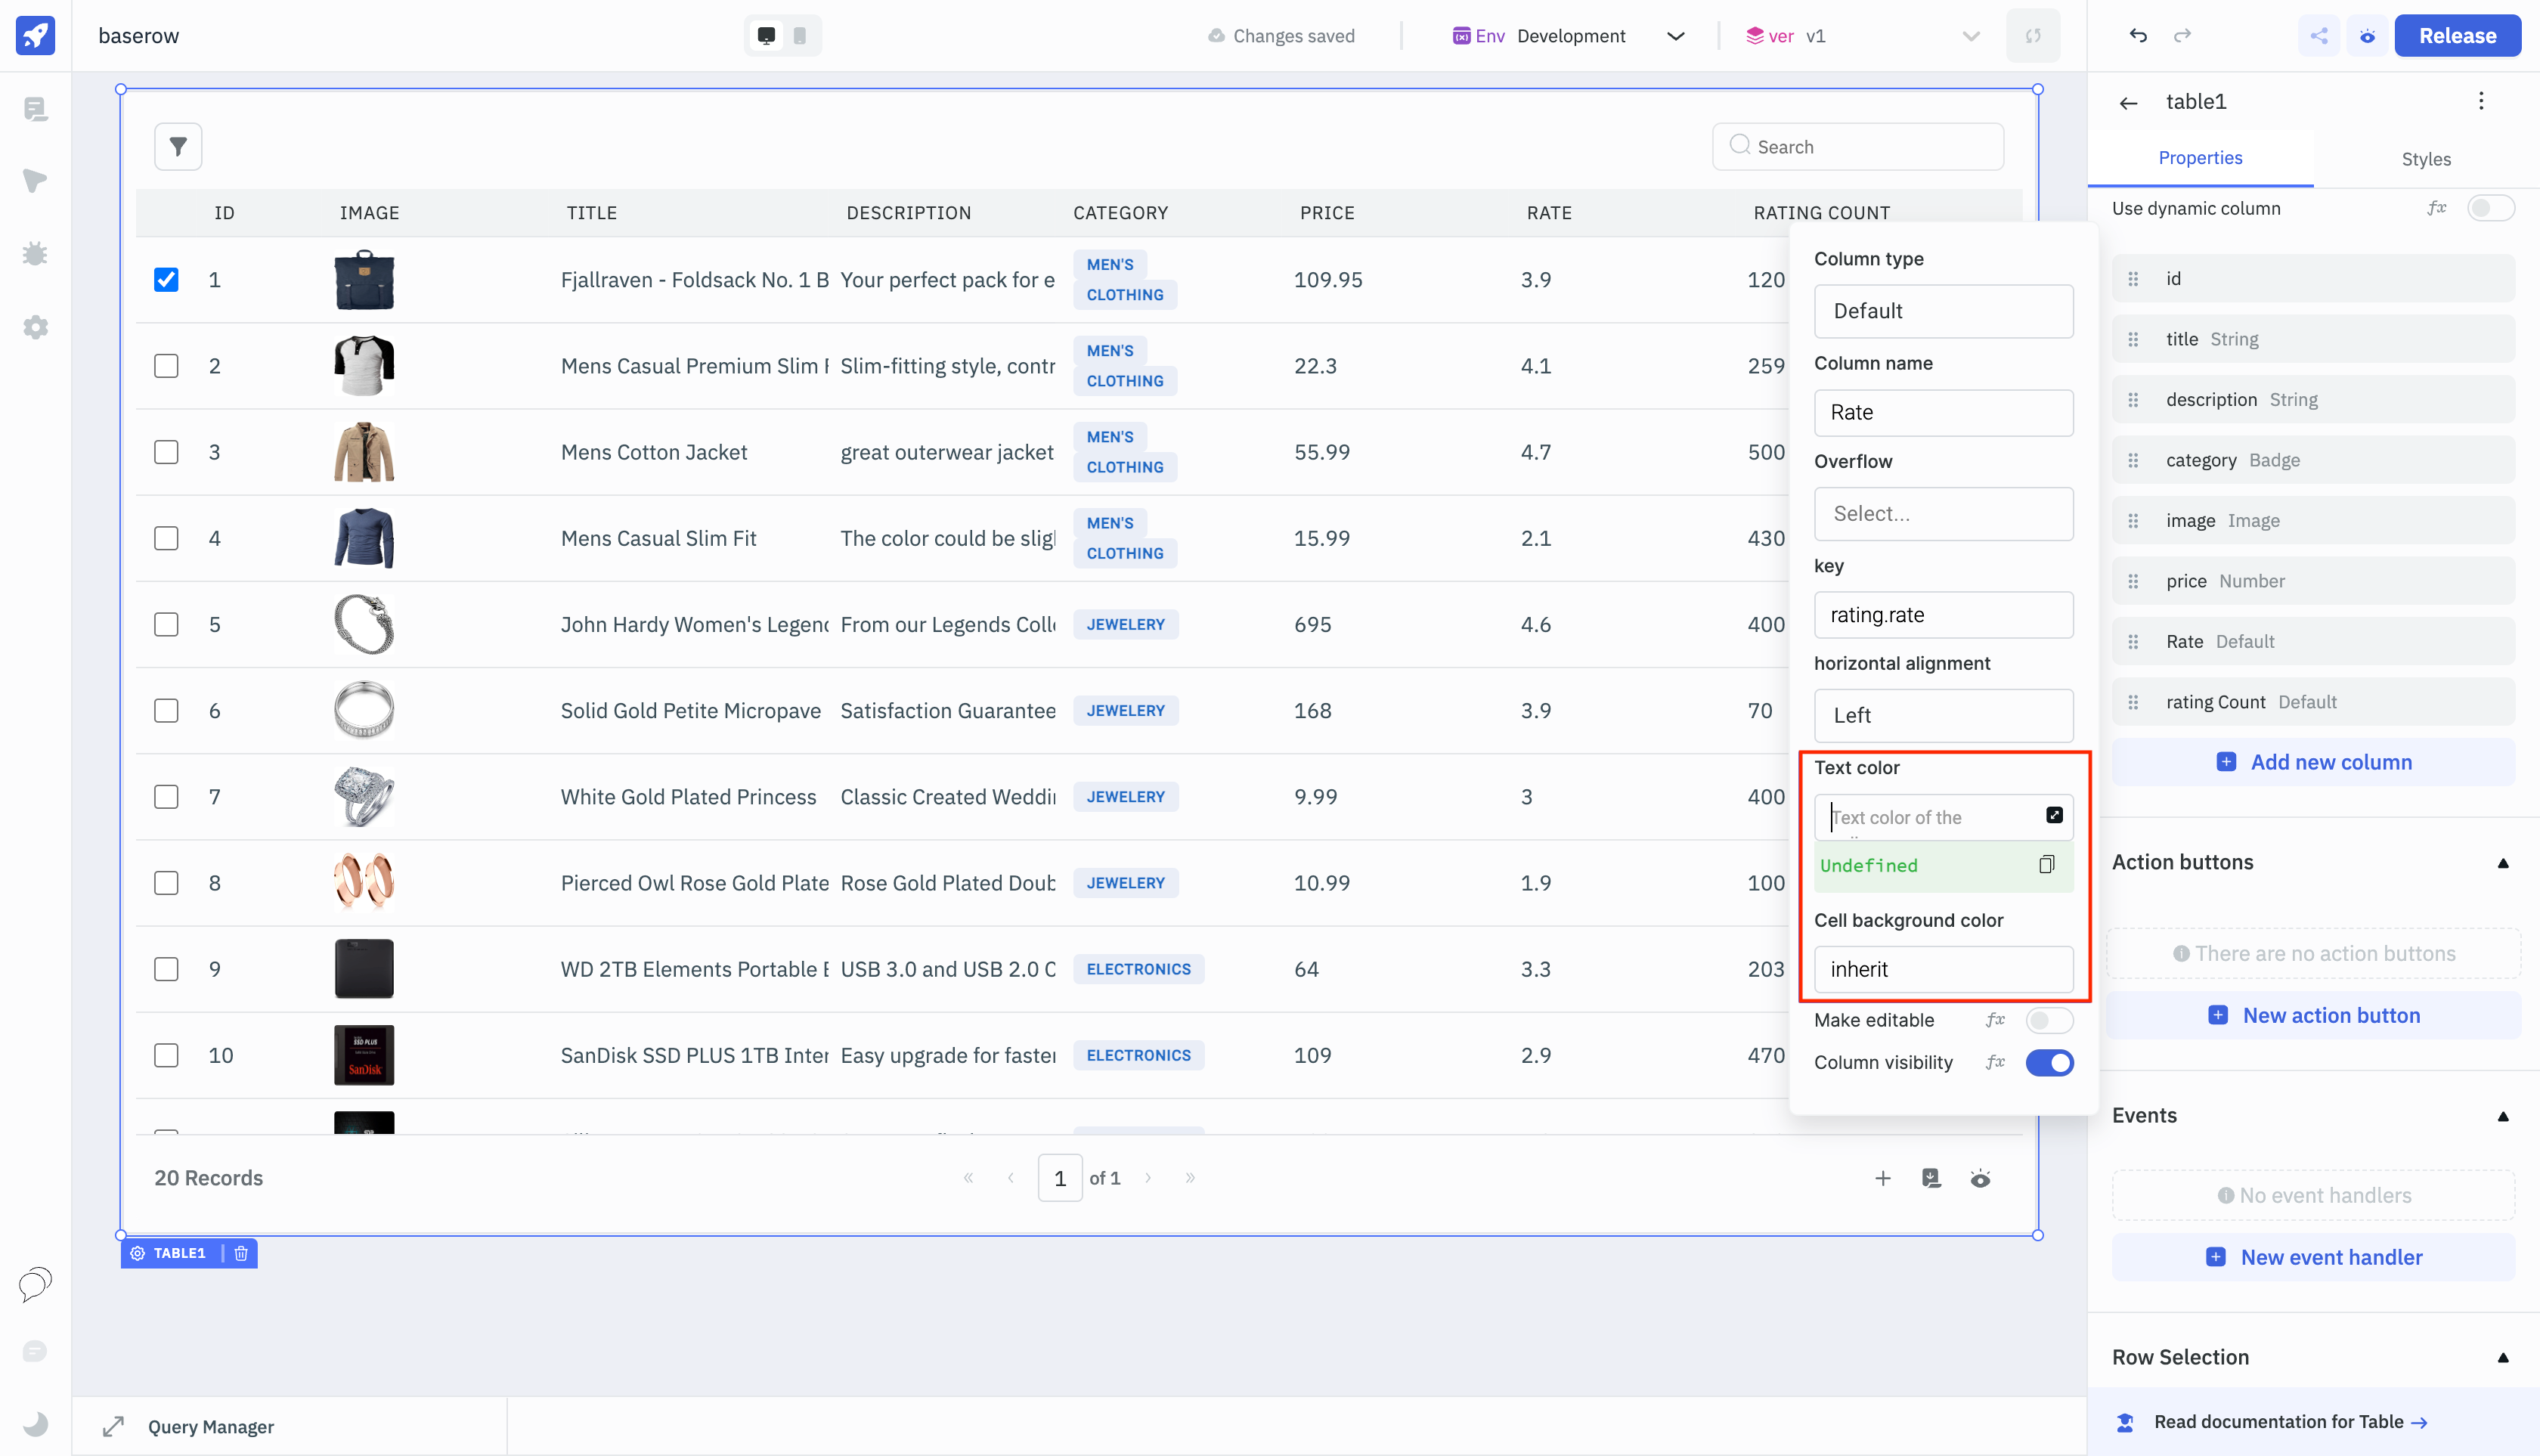
Columnsproperty of the Table component. -
Select the column for which you want to enable conditional formatting (e.g., category).
-
If the column type is set to
DefaultorString, you can set the conditional formatting forText colorandCell background color.
Note: Only cellValue and rowData can be used as identifiers for conditional formatting.
Conditional Formatting using Cell Value
Example 1: Changing Text Color Based on Cell Value
-
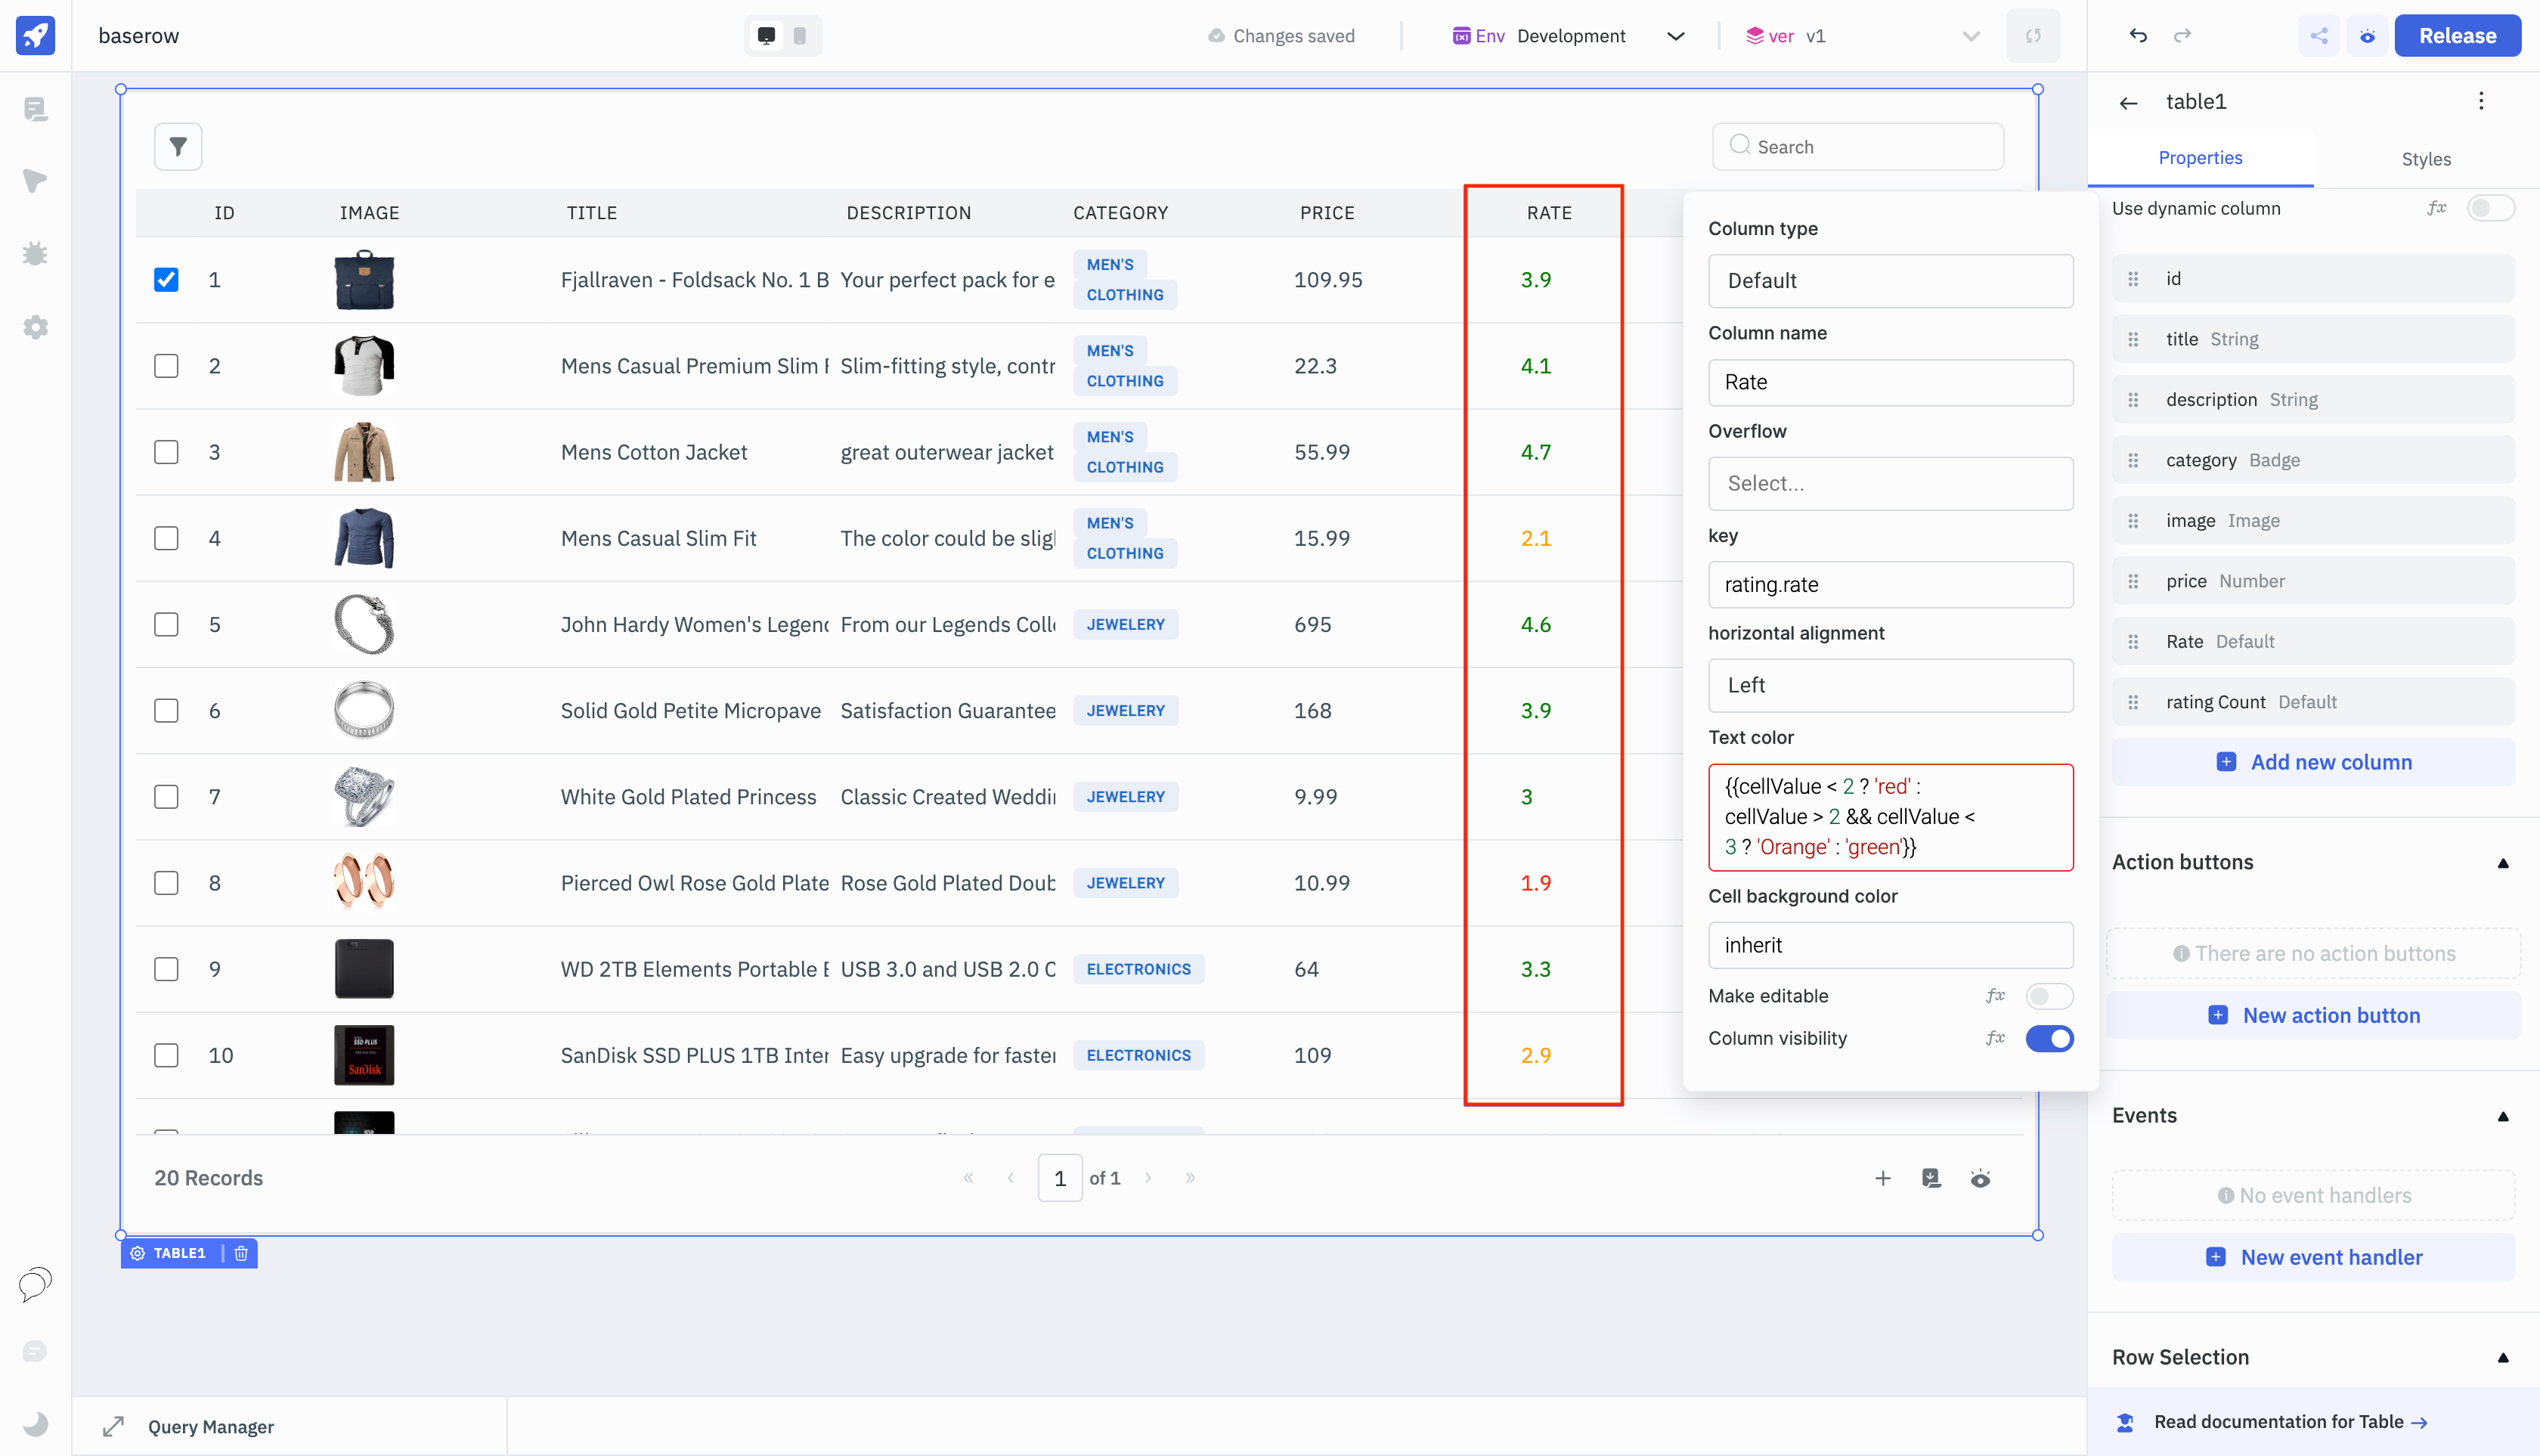
Select the
Ratecolumn which has a column type ofDefault/String. This column contains the rating of each product on a scale of 1 to 5. -
Under the
Text colorproperty, enter the following condition:
{{cellValue < 2 ? 'red' : cellValue > 2 && cellValue < 3 ? 'Orange' : 'green'}}
The above condition will change the text color to red if the cell value is less than 2, orange if the cell value is greater than 2 and less than 3, and green if the cell value is greater than 3.
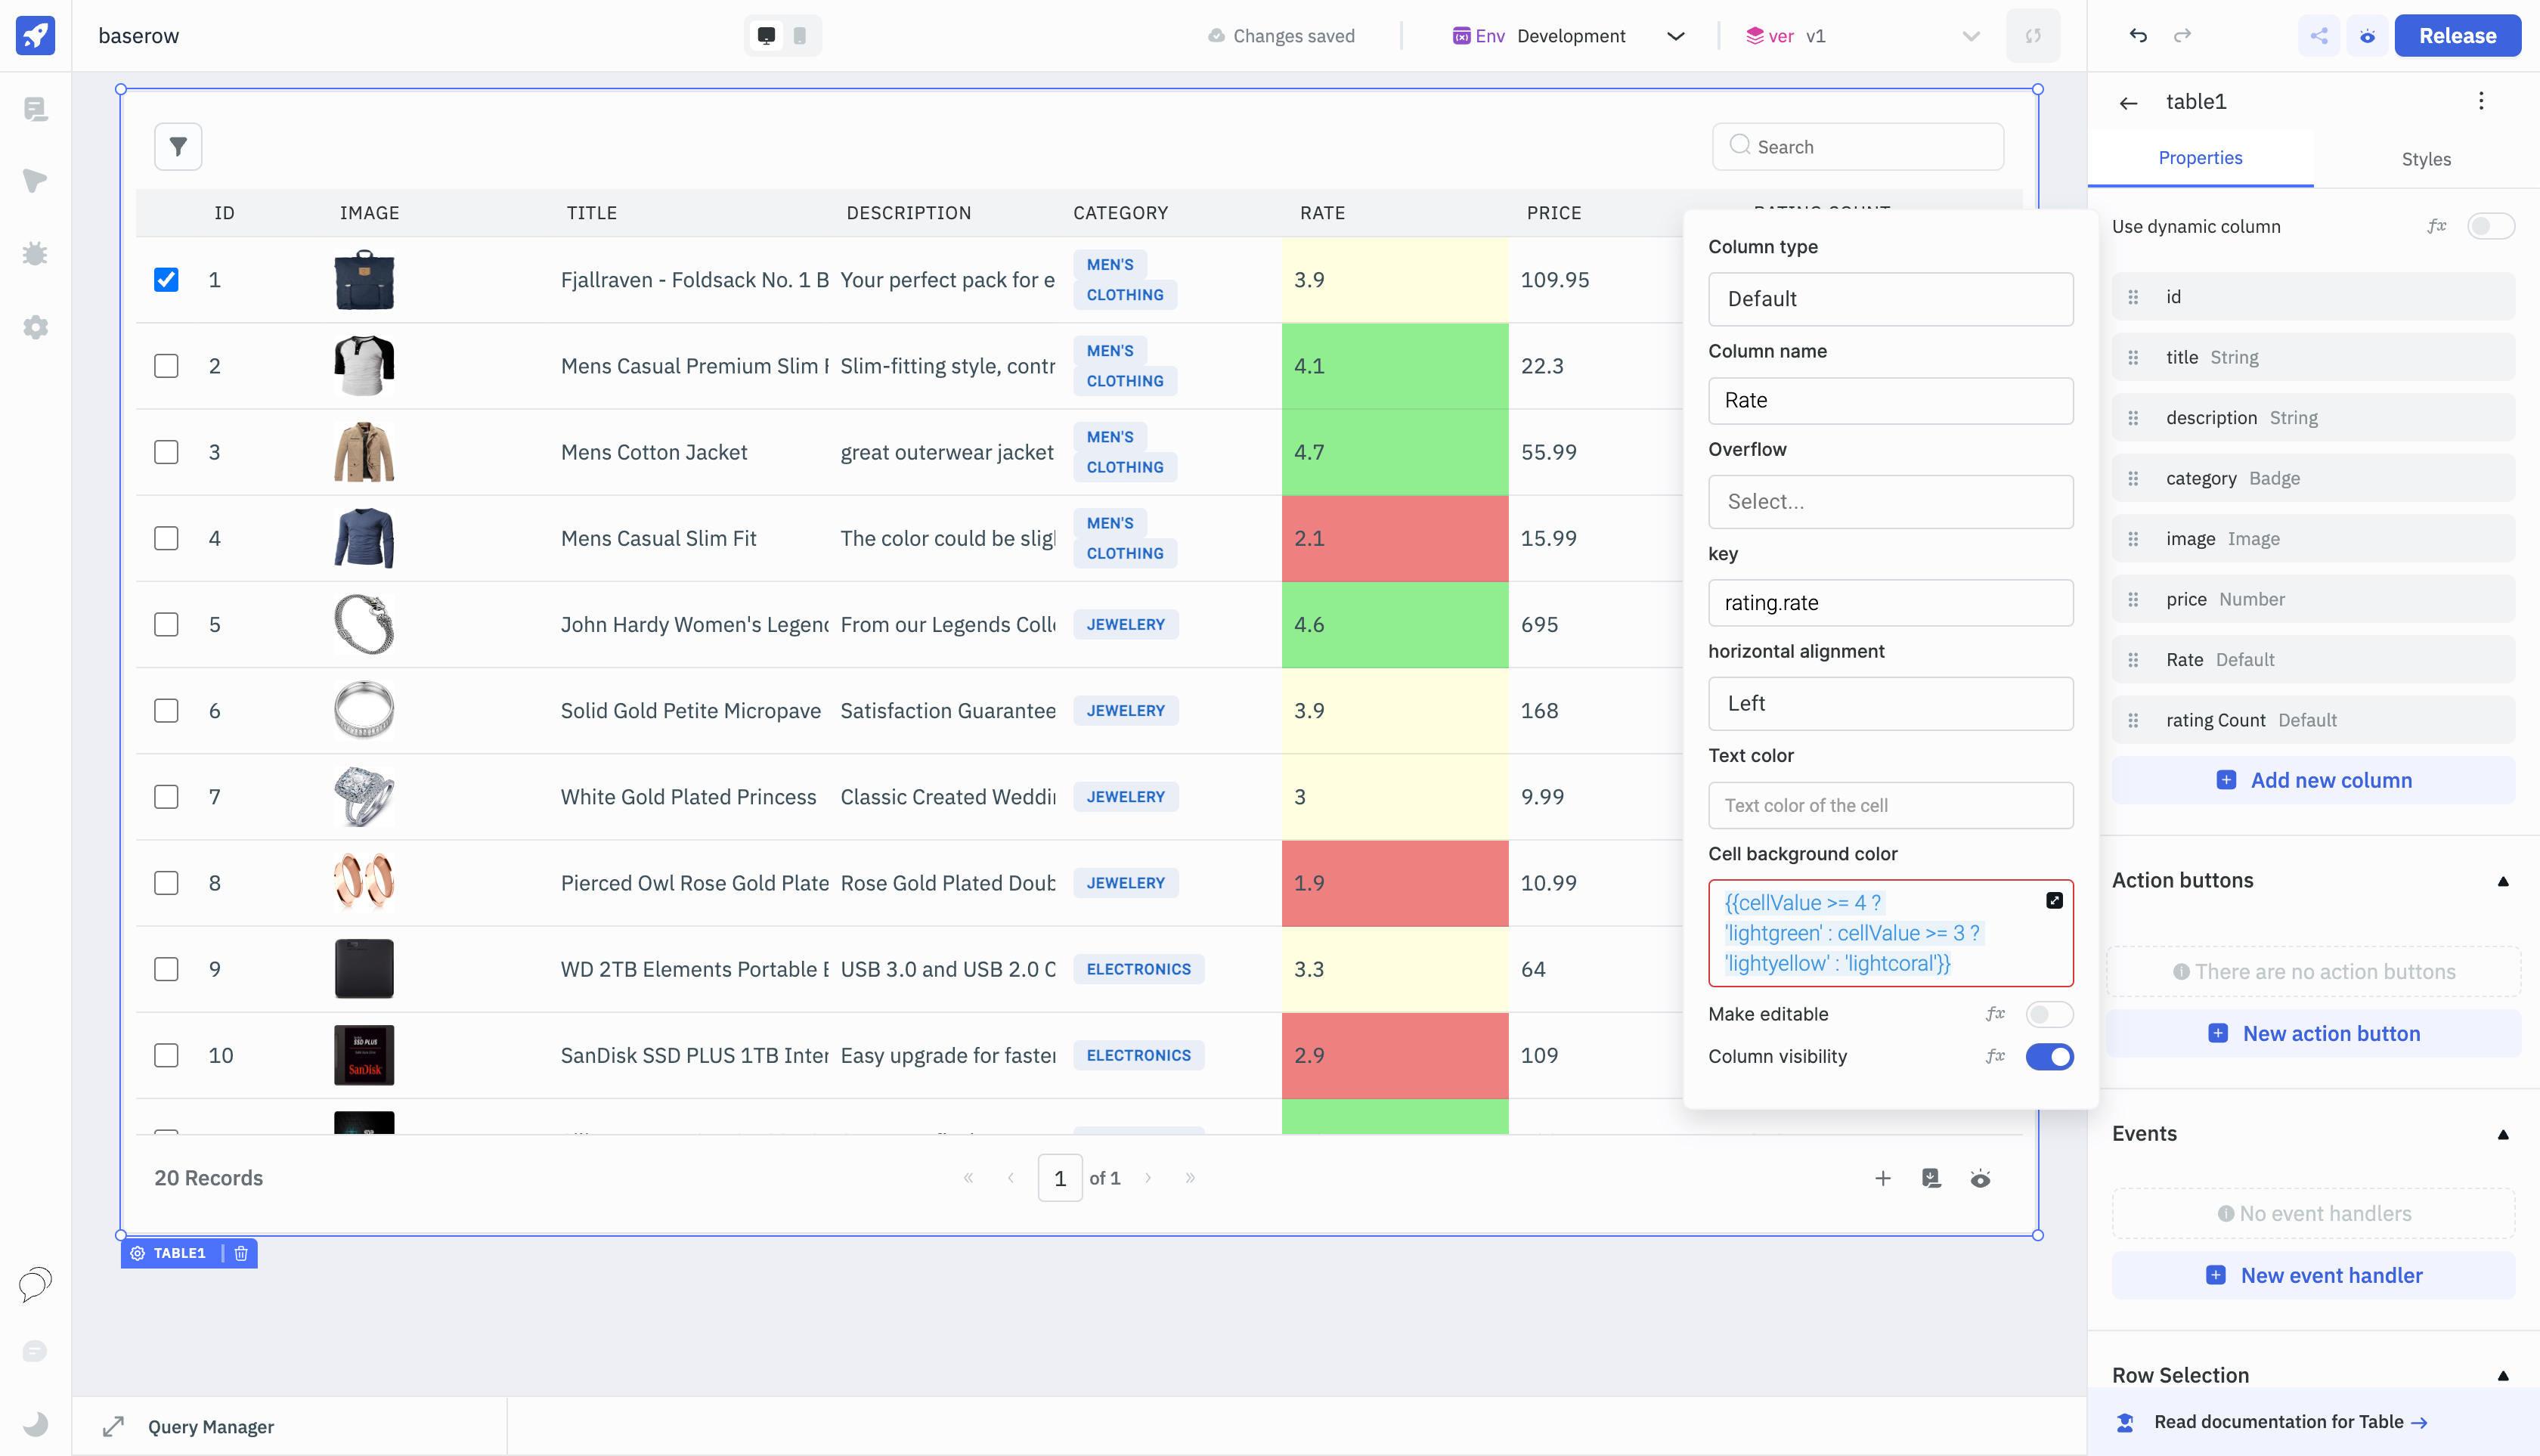
Example 2: Changing Cell Background Color Based on Cell Value
- Select the
Ratecolumn, enter the following condition under theCell background colorproperty:
{{cellValue >= 4 ? 'lightgreen' : cellValue >= 3 ? 'lightyellow' : 'lightcoral'}}
The above condition will change the cell background color to lightgreen if the cell value is greater than or equal to 4, lightyellow if the cell value is greater than or equal to 3, and lightcoral if the cell value is less than 3.
Conditional Formatting using Row Data
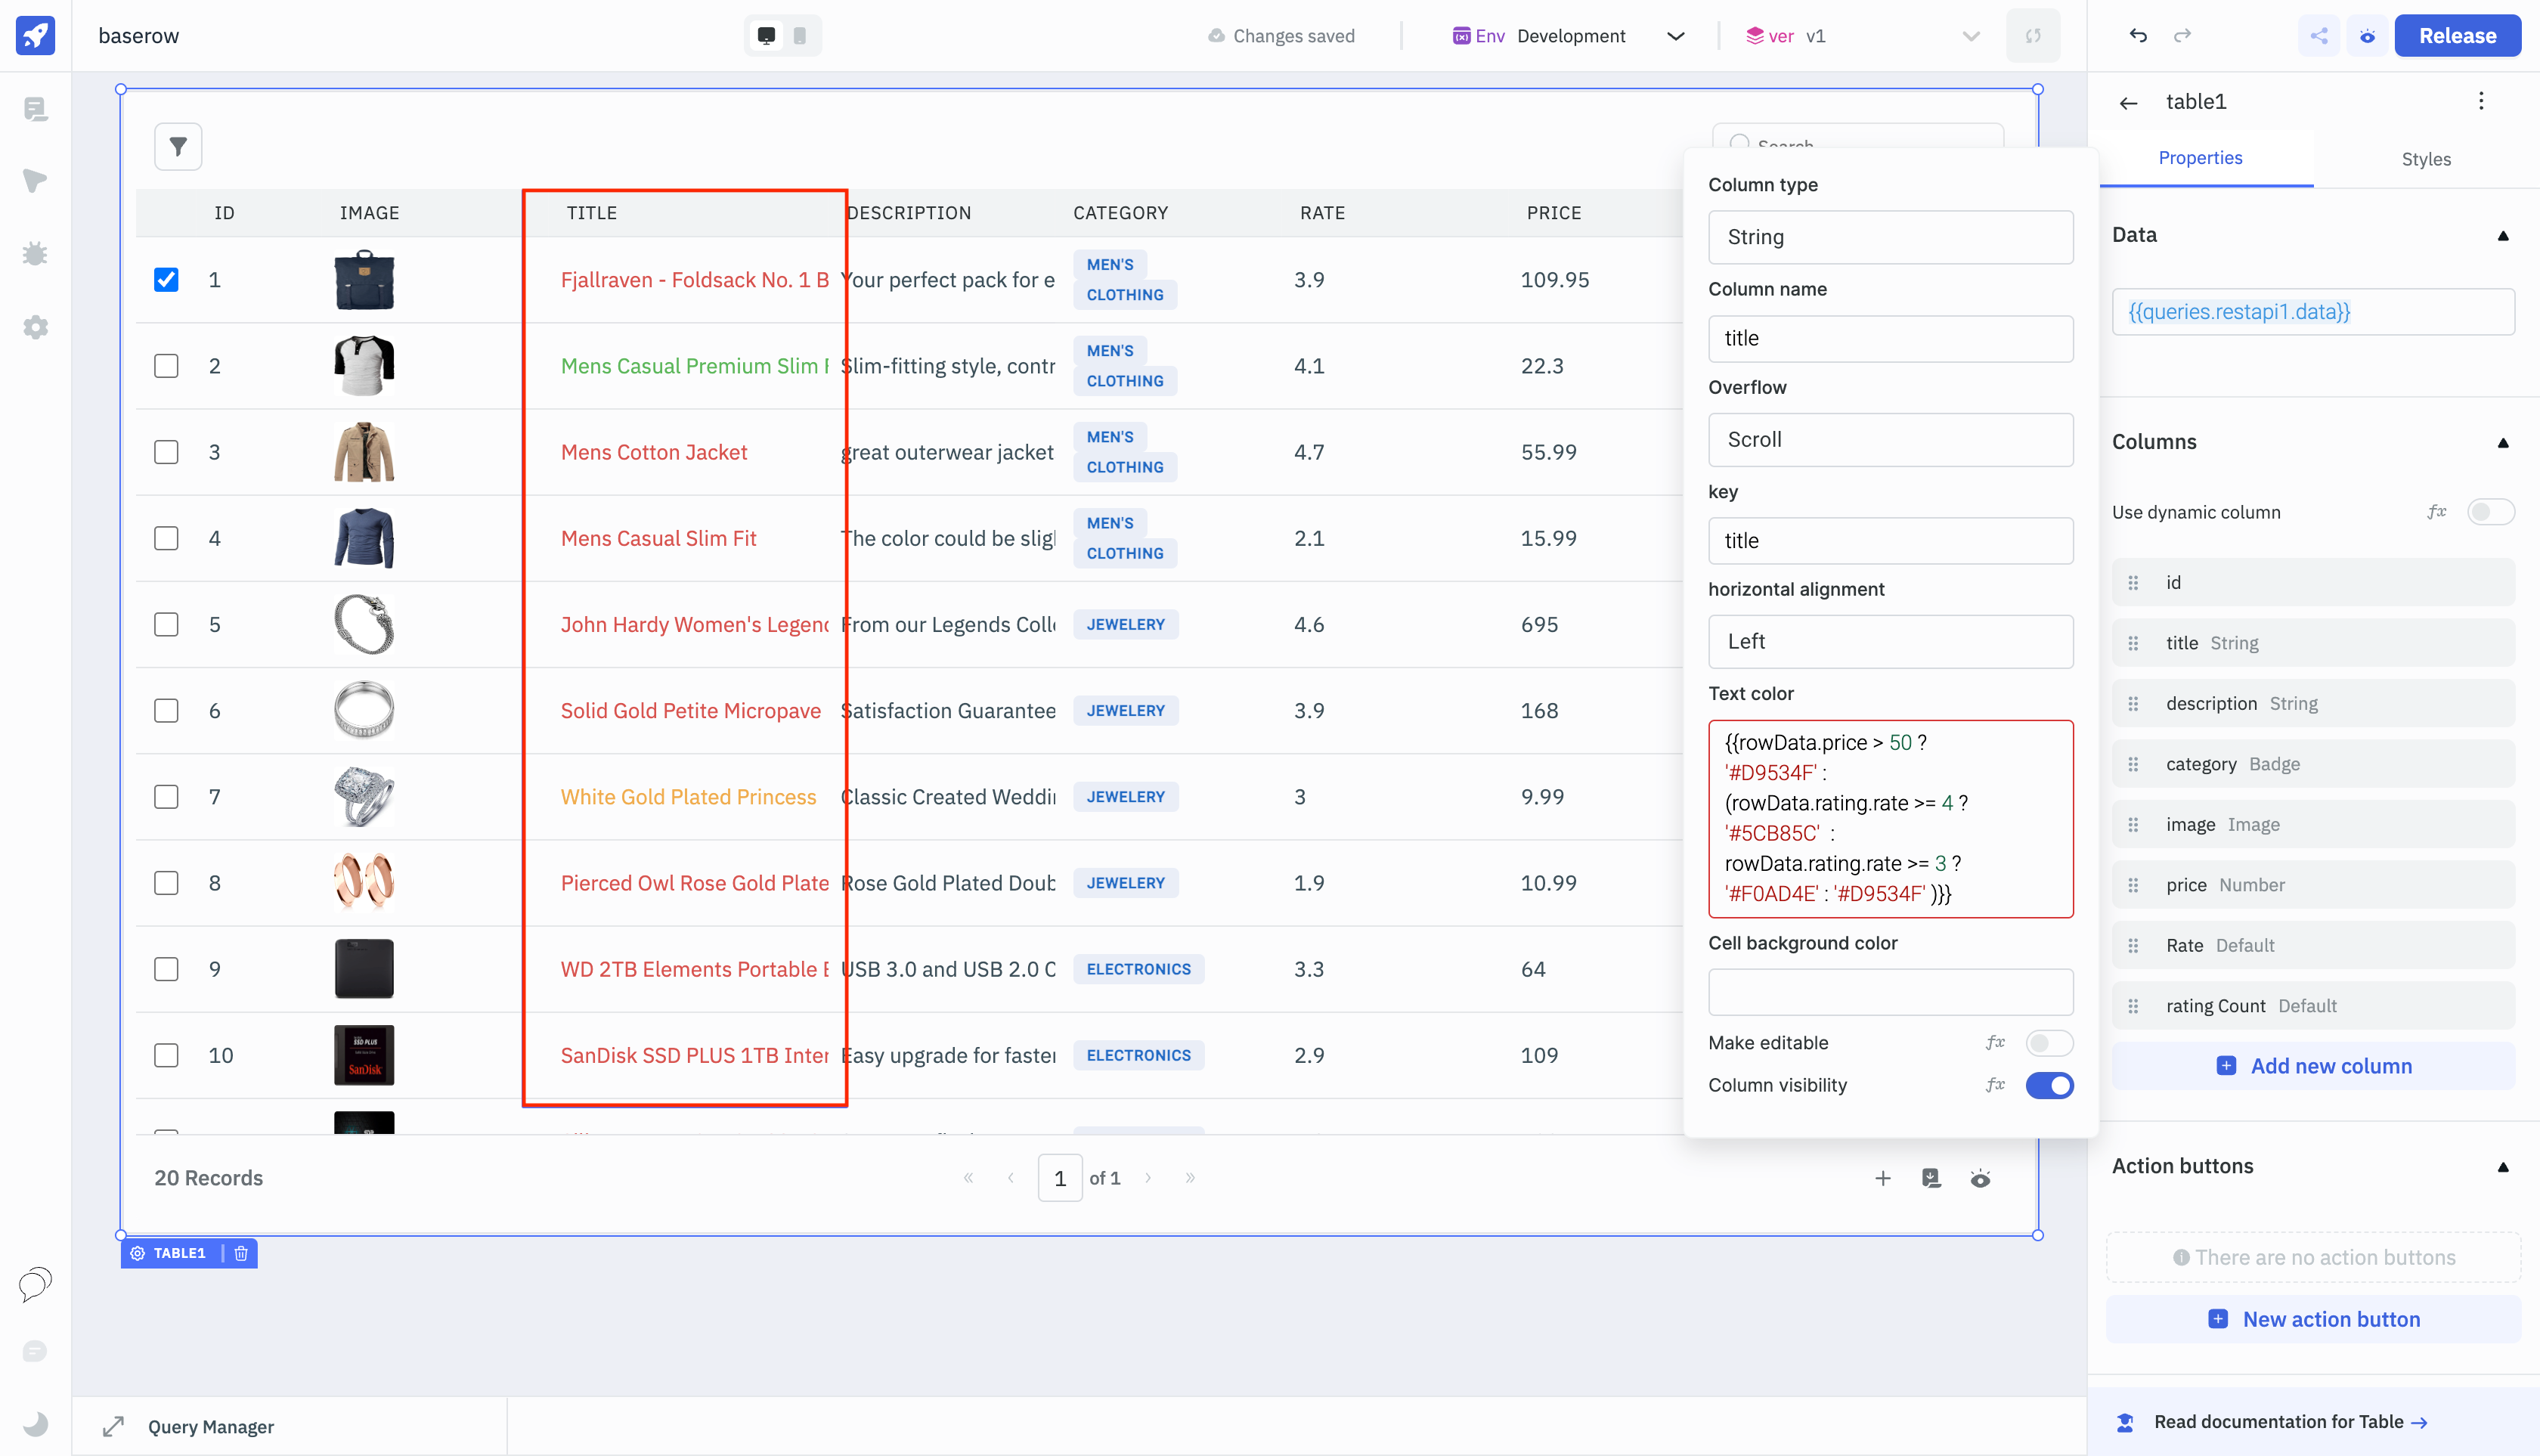
Example 1: Changing Text Color Based on Row Data
- Select the
Titlecolumn, enter the following condition under theText colorproperty:
{{rowData.price > 50 ? '#D9534F' : (rowData.rating.rate >= 4 ? '#5CB85C' : rowData.rating.rate >= 3 ? '#F0AD4E' : '#D9534F' )}}
The above condition will change the text color of the Title based on the value of the price and rating columns. If the value in the price column is greater than 50, the text color will be red. If the value in the rating column is greater than or equal to 4, the text color will be green. If the value in the rating column is greater than or equal to 3, the text color will be yellow. Otherwise, the text color will be red.
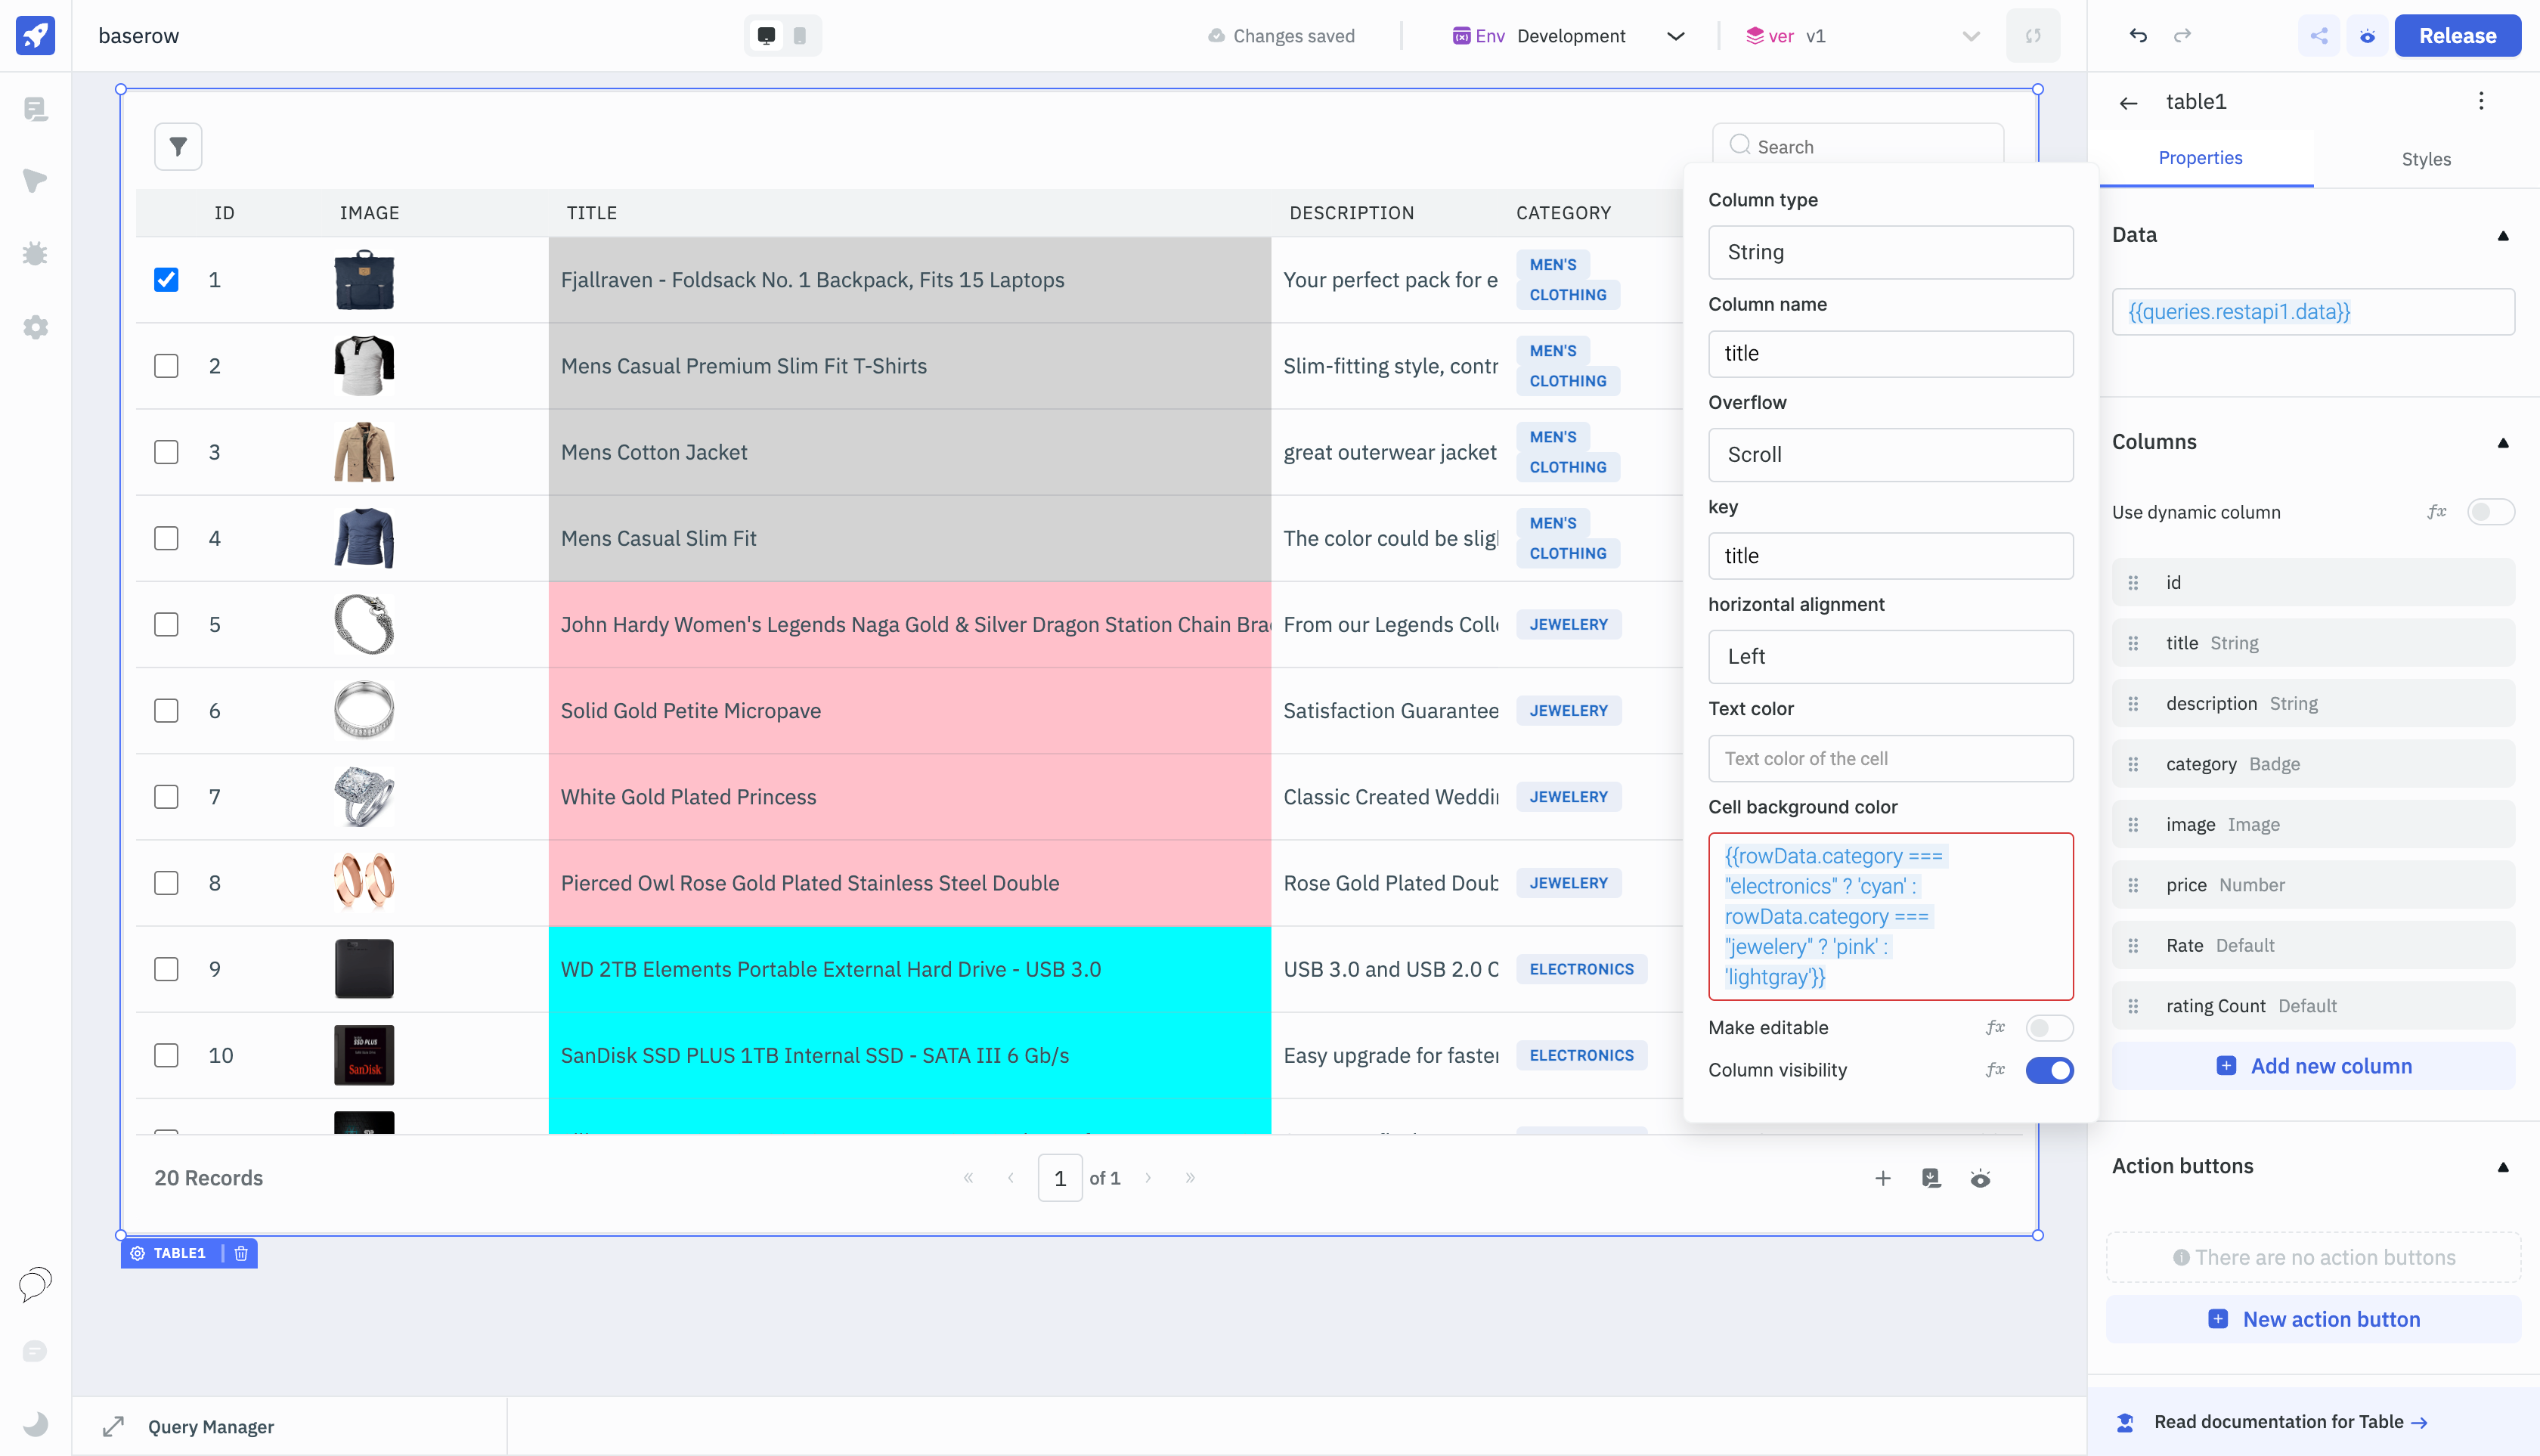
Example 2: Changing Cell Background Color based on Row Data
-
In this example, we will change the cell background color of the
Titlecolumn based on the category of the product. -
Select the
Titlecolumn, enter the following condition under theCell background colorproperty:
{{rowData.category === "electronics" ? 'cyan' : rowData.category === "jewelery" ? 'pink' : 'lightgray'}}
The above condition will change the cell background color of the Title column based on the value of the category column. If the value in the category column is electronics, the cell background color will be cyan. If the value in the category column is jewelery, the cell background color will be pink. Otherwise, the cell background color will be lightgray.
By following these steps, you can implement advanced conditional formatting for Text color and Cell background color in your Table component. Experiment with different conditions and color combinations to create visually appealing and informative tables in your applications.