Chart
Chart widget takes the chart type, data and styles to draw charts using Plotly.js.
How To Use Chart Widget
Chart types
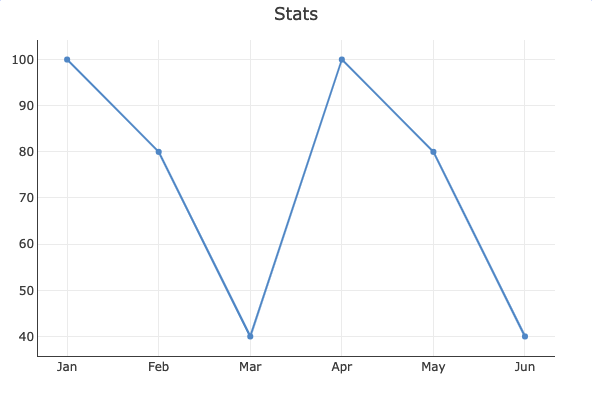
Line charts
Data requirements: The data needs to be an array of objects and each object should have x and y keys.
Example:
[
  { "x": "Jan", "y": 100},
  { "x": "Feb", "y": 80},
  { "x": "Mar", "y": 40},
  { "x": "Apr", "y": 100},
  { "x": "May", "y": 80},
  { "x": "Jun", "y": 40}
]
The chart will look like this:
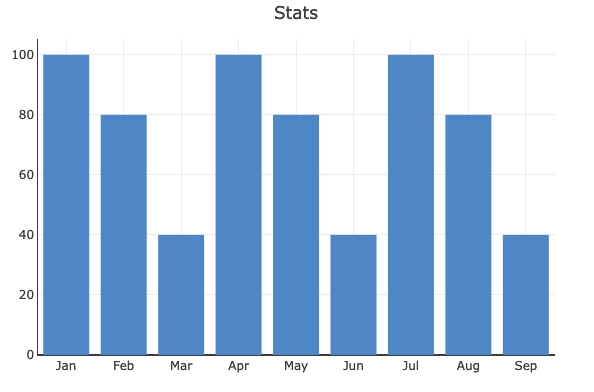
Bar charts
Data requirements: The data needs to be an array of objects and each object should have x and y keys.
Example:
[
  { "x": "Jan", "y": 100},
  { "x": "Feb", "y": 80},
  { "x": "Mar", "y": 40},
  { "x": "Apr", "y": 100},
  { "x": "May", "y": 80},
  { "x": "Jun", "y": 40},
  { "x": "Jul", "y": 100},
  { "x": "Aug", "y": 80},
  { "x": "Sep", "y": 40}
]
The chart will look like this:
Pie charts
Data requirements: The data needs to be an array of objects and each object should have label and value keys.
Example:
[
  { "x": "Jan", "y": 100},
  { "x": "Feb", "y": 80},
  { "x": "Mar", "y": 40},
  { "x": "Apr", "y": 100},
  { "x": "May", "y": 80},
  { "x": "Jun", "y": 40}
]
The chart will look like this:
Properties
Any property having Fx button next to its field can be programmatically configured.
Title
This field is used to add a title to your selected chart.
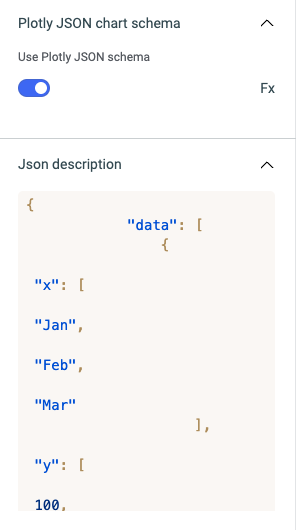
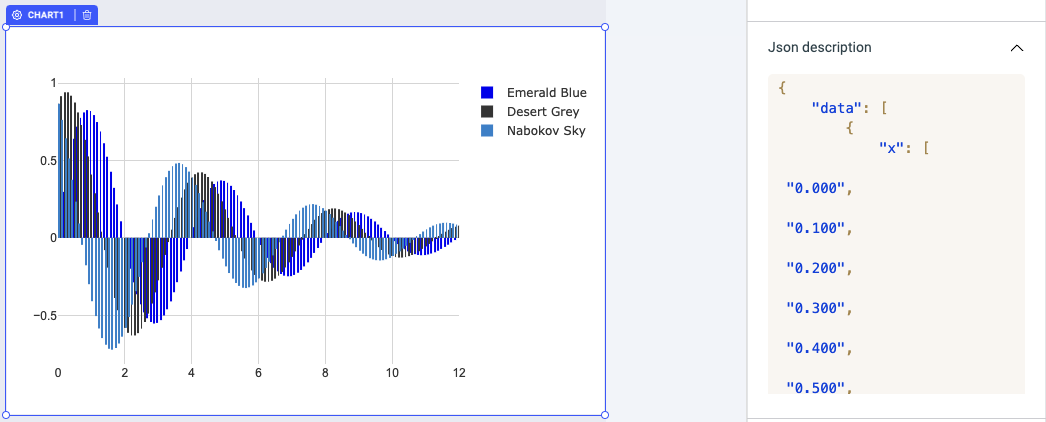
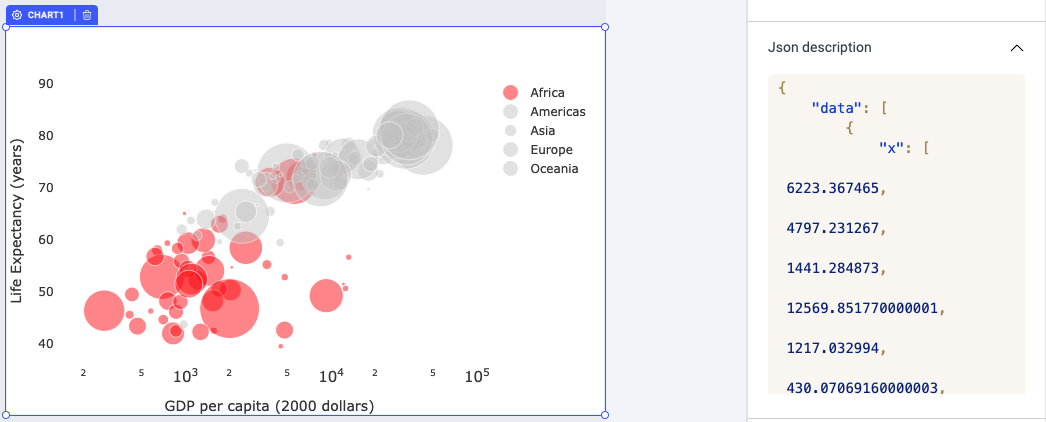
Plotly JSON chart schema
In the chart widget, you can also plot a chart with JSON data. So the JSON will contain the information about the chart type, chart data, etc. You can learn more about the JSON properties from here.
Anyway, to work with the JSON you need to enable the Use Plotly JSON schema toggle from the properties section.
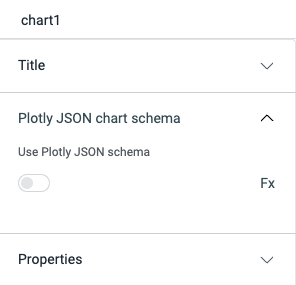
It will show the JSON description field to put the JSON data.
The result will be like this:
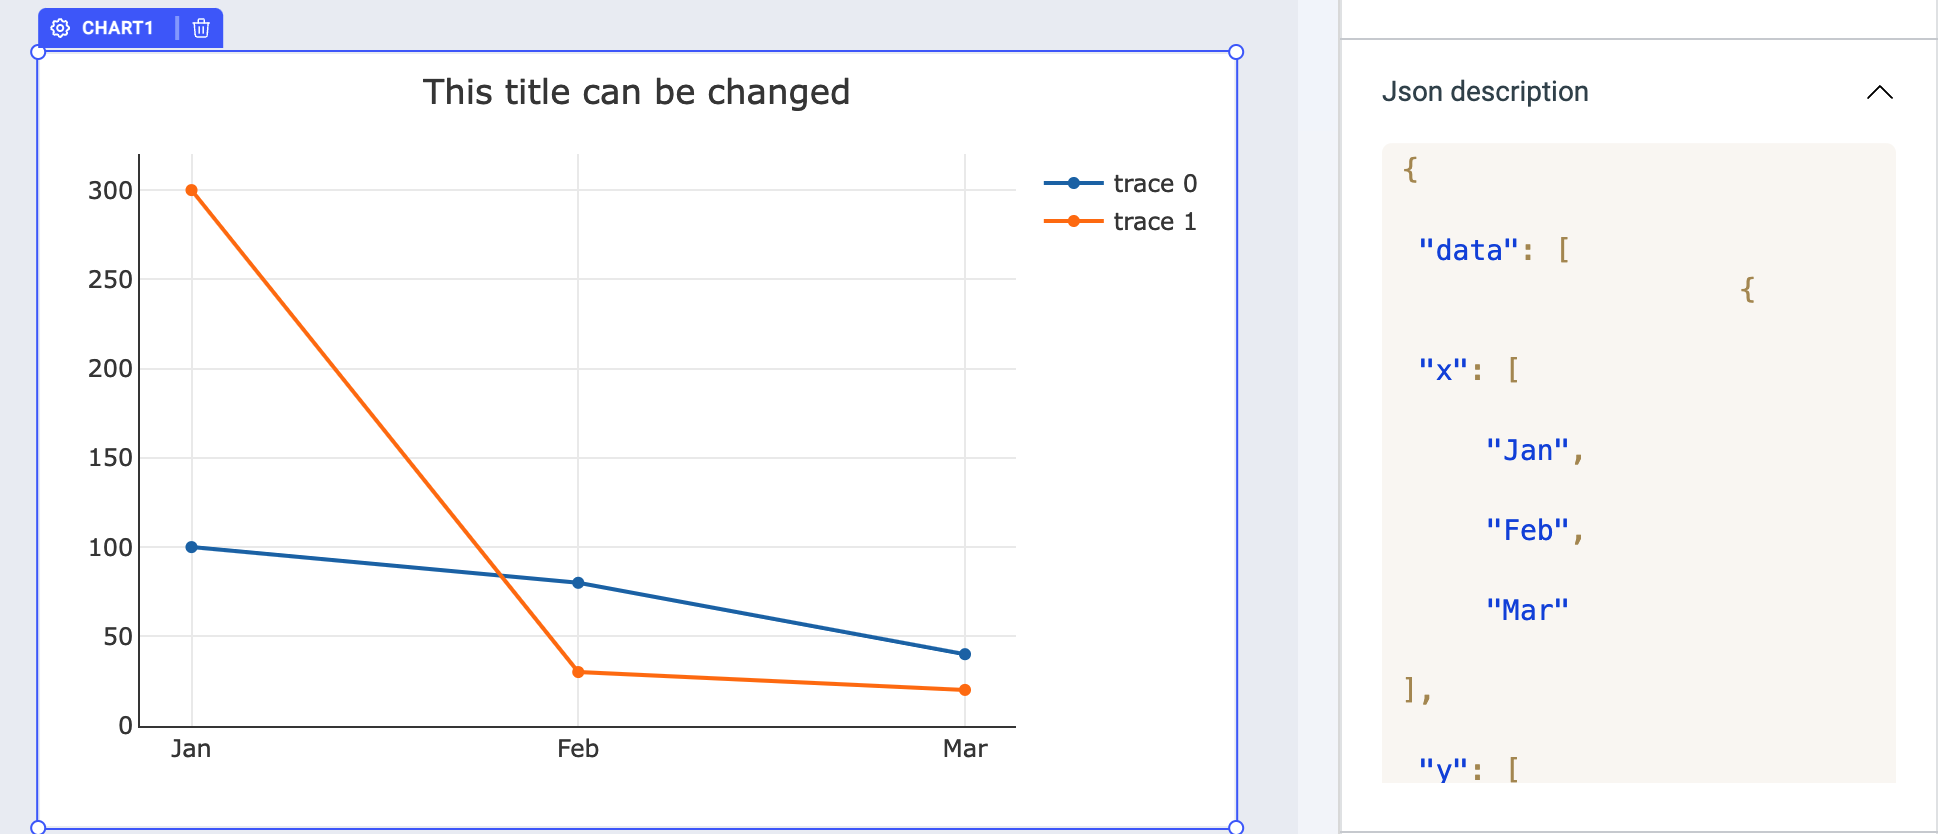
Using Plotly JSON chart schema
In the JSON description, the value needs to be the data array with x and y axis values and at the end we need to specify the type. let's take a look at the examples for different chart types.
Line
  {
                "data": [
                    {
                        "x": [
                            "Jan",
                            "Feb",
                            "Mar"
                        ],
                        "y": [
                            100,
                            80,
                            40
                        ],
                        "type": "line"
                    },
                    {
                        "x": [
                            "Jan",
                            "Feb",
                            "Mar"
                        ],
                        "y": [
                            300,
                            30,
                            20
                        ],
                        "type": "line"
                    }
                ]
            }
Bar
{
    "data": [
        {
            "name": "SF Zoo",
            "type": "bar",
            "x": [
                20,
                14,
                23
            ],
            "y": [
                "giraffes",
                "orangutans",
                "monkeys"
            ],
            "marker": {
                "line": {
                    "color": "rgba(55, 128, 191, 1.0)",
                    "width": 1
                },
                "color": "rgba(55, 128, 191, 0.6)"
            },
            "orientation": "h"
        },
        {
            "name": "LA Zoo",
            "type": "bar",
            "x": [
                12,
                18,
                29
            ],
            "y": [
                "giraffes",
                "orangutans",
                "monkeys"
            ],
            "marker": {
                "line": {
                    "color": "rgba(255, 153, 51, 1.0)",
                    "width": 1
                },
                "color": "rgba(255, 153, 51, 0.6)"
            },
            "orientation": "h"
        }
    ],
    "layout": {
        "barmode": "stack"
    },
    "frames": []
}
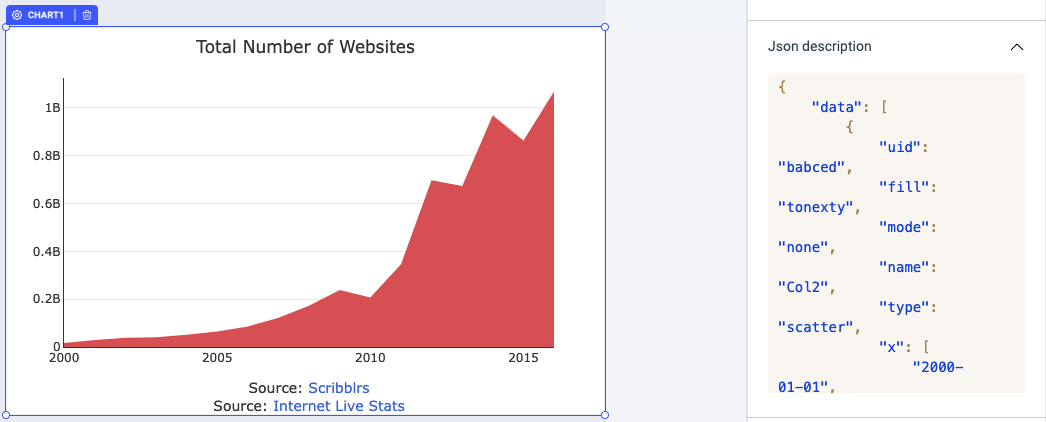
Area
{
    "data": [
        {
            "uid": "babced",
            "fill": "tonexty",
            "mode": "none",
            "name": "Col2",
            "type": "scatter",
            "x": [
                "2000-01-01",
                "2001-01-01",
                "2002-01-01",
                "2003-01-01",
                "2004-01-01",
                "2005-01-01",
                "2006-01-01",
                "2007-01-01",
                "2008-01-01",
                "2009-01-01",
                "2010-01-01",
                "2011-01-01",
                "2012-01-01",
                "2013-01-01",
                "2014-01-01",
                "2015-01-01",
                "2016-01-01"
            ],
            "y": [
                "17087182",
                "29354370",
                "38760373",
                "40912332",
                "51611646",
                "64780617",
                "85507314",
                "121892559",
                "172338726",
                "238027855",
                "206956723",
                "346004403",
                "697089489",
                "672985183",
                "968882453",
                "863105652",
                "1068513050"
            ],
            "fillcolor": "rgb(224, 102, 102)"
        }
    ],
    "layout": {
        "title": "Total Number of Websites",
        "width": 800,
        "xaxis": {
            "type": "date",
            "range": [
                946702800000,
                1451624400000
            ],
            "title": "Source: <a href=\"http://www.scribblrs.com/\">Scribblrs</a><br>Source: <a href=\"http://www.internetlivestats.com/total-number-of-websites/\">Internet Live Stats</a>",
            "showgrid": false,
            "autorange": true,
            "tickformat": "%Y"
        },
        "yaxis": {
            "type": "linear",
            "range": [
                0,
                1124750578.9473684
            ],
            "title": "",
            "autorange": true
        },
        "height": 500,
        "autosize": false
    },
    "frames": []
}
Few more exmaples:
Link to JSON description: https://raw.githubusercontent.com/plotly/plotly.js/master/test/image/mocks/0.json
Link to JSON description: https://raw.githubusercontent.com/plotly/plotly.js/master/test/image/mocks/12.json
Check the Plotly documentation to explore the all type of charts available.
Marker color
Modify the color of marker using the color picker or by providing a HEX color code.
Options
Loading state
Toggle on the switch to display a loader on the widget. You can also programmatically define it's value by clicking on Fx, acceptable values are - {{true}} and {{false}}.
Show Axes
Enable or disable the x and y axes on the chart through this property. You can also programmatically define it's value by clicking on Fx, acceptable values are - {{true}} and {{false}}.
Show grid lines
Toggle on or off to show or hide the grid lines on the chart. You can also programmatically define it's value by clicking on Fx, acceptable values are - {{true}} and {{false}}.
Layout
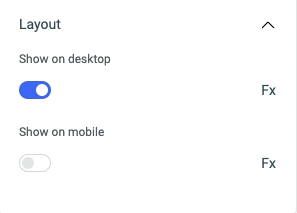
Show on desktop
Toggle on or off to display the widget in desktop view. You can programmatically determine the value by clicking on Fx to set the value {{true}} or {{false}}.
Show on mobile
Toggle on or off to display the widget in mobile view. You can programmatically determine the value by clicking on Fx to set the value {{true}} or {{false}}.
Styles
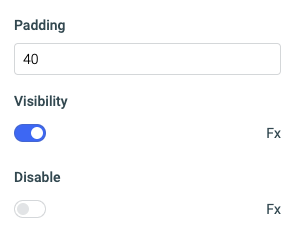
Padding
Define a space between the widget element and the widget border using Padding property. Use any numerical value between 1 to 100.
Visibility
Toggle on or off to control the visibility of the widget. You can programmatically change its value by clicking on the Fx button next to it. If {{false}} the widget will not be visible after the app is deployed. By default, it's set to {{true}}.
Disable
This is off by default, toggle on the switch to lock the widget and make it non-functional. You can also programmatically set the value by clicking on the Fx button next to it. If set to {{true}}, the widget will be locked and becomes non-functional. By default, its value is set to {{false}}.