Understanding Logs
Debugging is a critical part of building applications, and ToolJet makes it easier with a built-in Debugger that tracks and displays logs in real time. Whether it’s a query success or failure, or a component malfunction, the debugger logs will help you get to the root of the problem quickly.
This guide walks you through making the most of ToolJet’s logs, with practical examples that explain why they matter and how to use them effectively.
How Logs Work
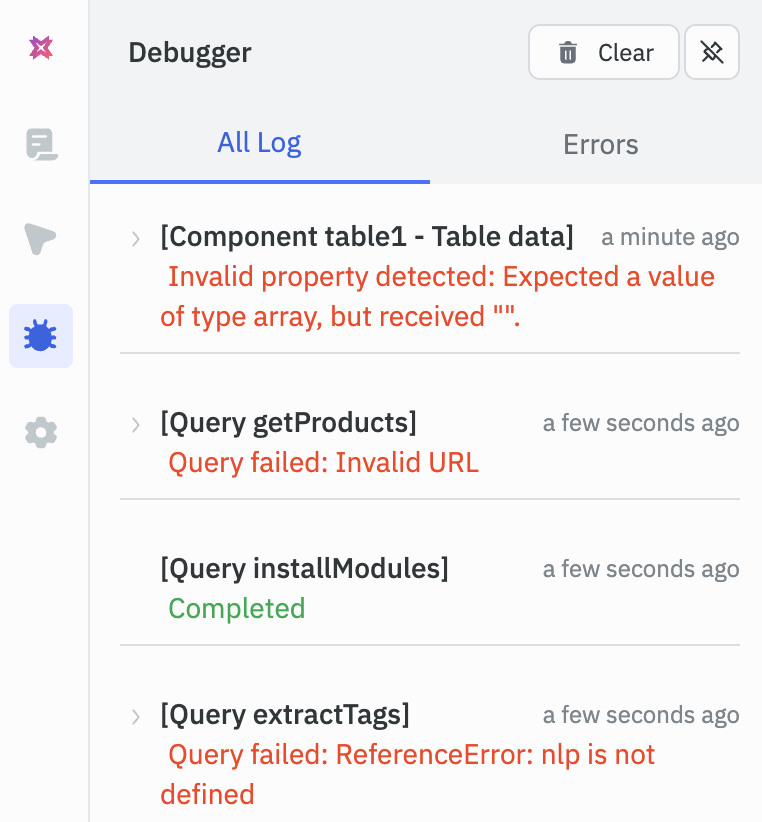
ToolJet captures real-time events and organizes them in the debugger panel.
In the App Builder, click the Debugger icon in the left sidebar to open the debugger panel. A badge on the icon shows the number of new errors since you last opened the panel. This panel becomes your main console for inspecting query execution results (success/failure) and component-level issues.
The debugger panel has two tabs:
- All logs: Every log entry, including successful queries, failed queries, component errors, and custom logs.
- Errors: Only error logs for the page you're currently on.
Click a log entry to expand its details. To remove all logs, click the trash icon at the top of the panel.
Custom Logs
In ToolJet, you can use custom log methods in Run JavaScript code queries and query transformations to capture errors, debug info, and runtime events in your app. These functions work similarly to JavaScript’s console.log() but offer clearer intent and structured logging. Each entry appears in the debugger labelled Custom Log, with the query name and line number. Entries from actions.logError also appear in the Errors tab.
Log Errors
Logs an error. Useful for failed API calls, exceptions, or critical issues.
actions.logError("API failed");
Log Information
Logs informational messages. Use for successful actions or state changes.
actions.logInfo("User logged in");
Log Messages
Generic log for debugging or checkpoints.
actions.log("Reached step 2");
Use Case
Debugging Queries
Let’s say you’re building an app and have integrated a REST API to fetch products. You’ve connected this query to a Table component, but when you run it, the data doesn’t show up. To troubleshoot this, open the debugger and go to the All logs tab. A successful run is logged as Completed. If the query failed, expand its log entry to see:
- The error message returned
- The request that was sent
- The response returned by the server, including its status code
- The values substituted into the query
This information helps you identify what went wrong and where to start troubleshooting.
Troubleshooting Component Related Issues
Let’s say you’ve fetched user data from a database using a query, and connected it to a table component. The query runs without errors, but the table still appears empty. To investigate this, open the debugger and go to the Errors tab. Here, you’ll find error logs related to the component’s behavior, such as:
- Invalid property detected errors, where a property's value doesn't match the type the property expects. Expand the entry to see the value you provided and the value the component used instead.
- Errors from event handlers on the component, such as a failed Run query action.
These logs help you determine whether the issue stems from component configuration or its interaction with the query result, making it easier to fix problems and get your UI working as expected.