Use Events on Chart
Currently, the chart component does not support events. However, you can use the Custom Component to create a chart using a third-party library that supports events. Plotly is one of the libraries that supports events. In this tutorial, we will build a chart using Plotly and add events to it.
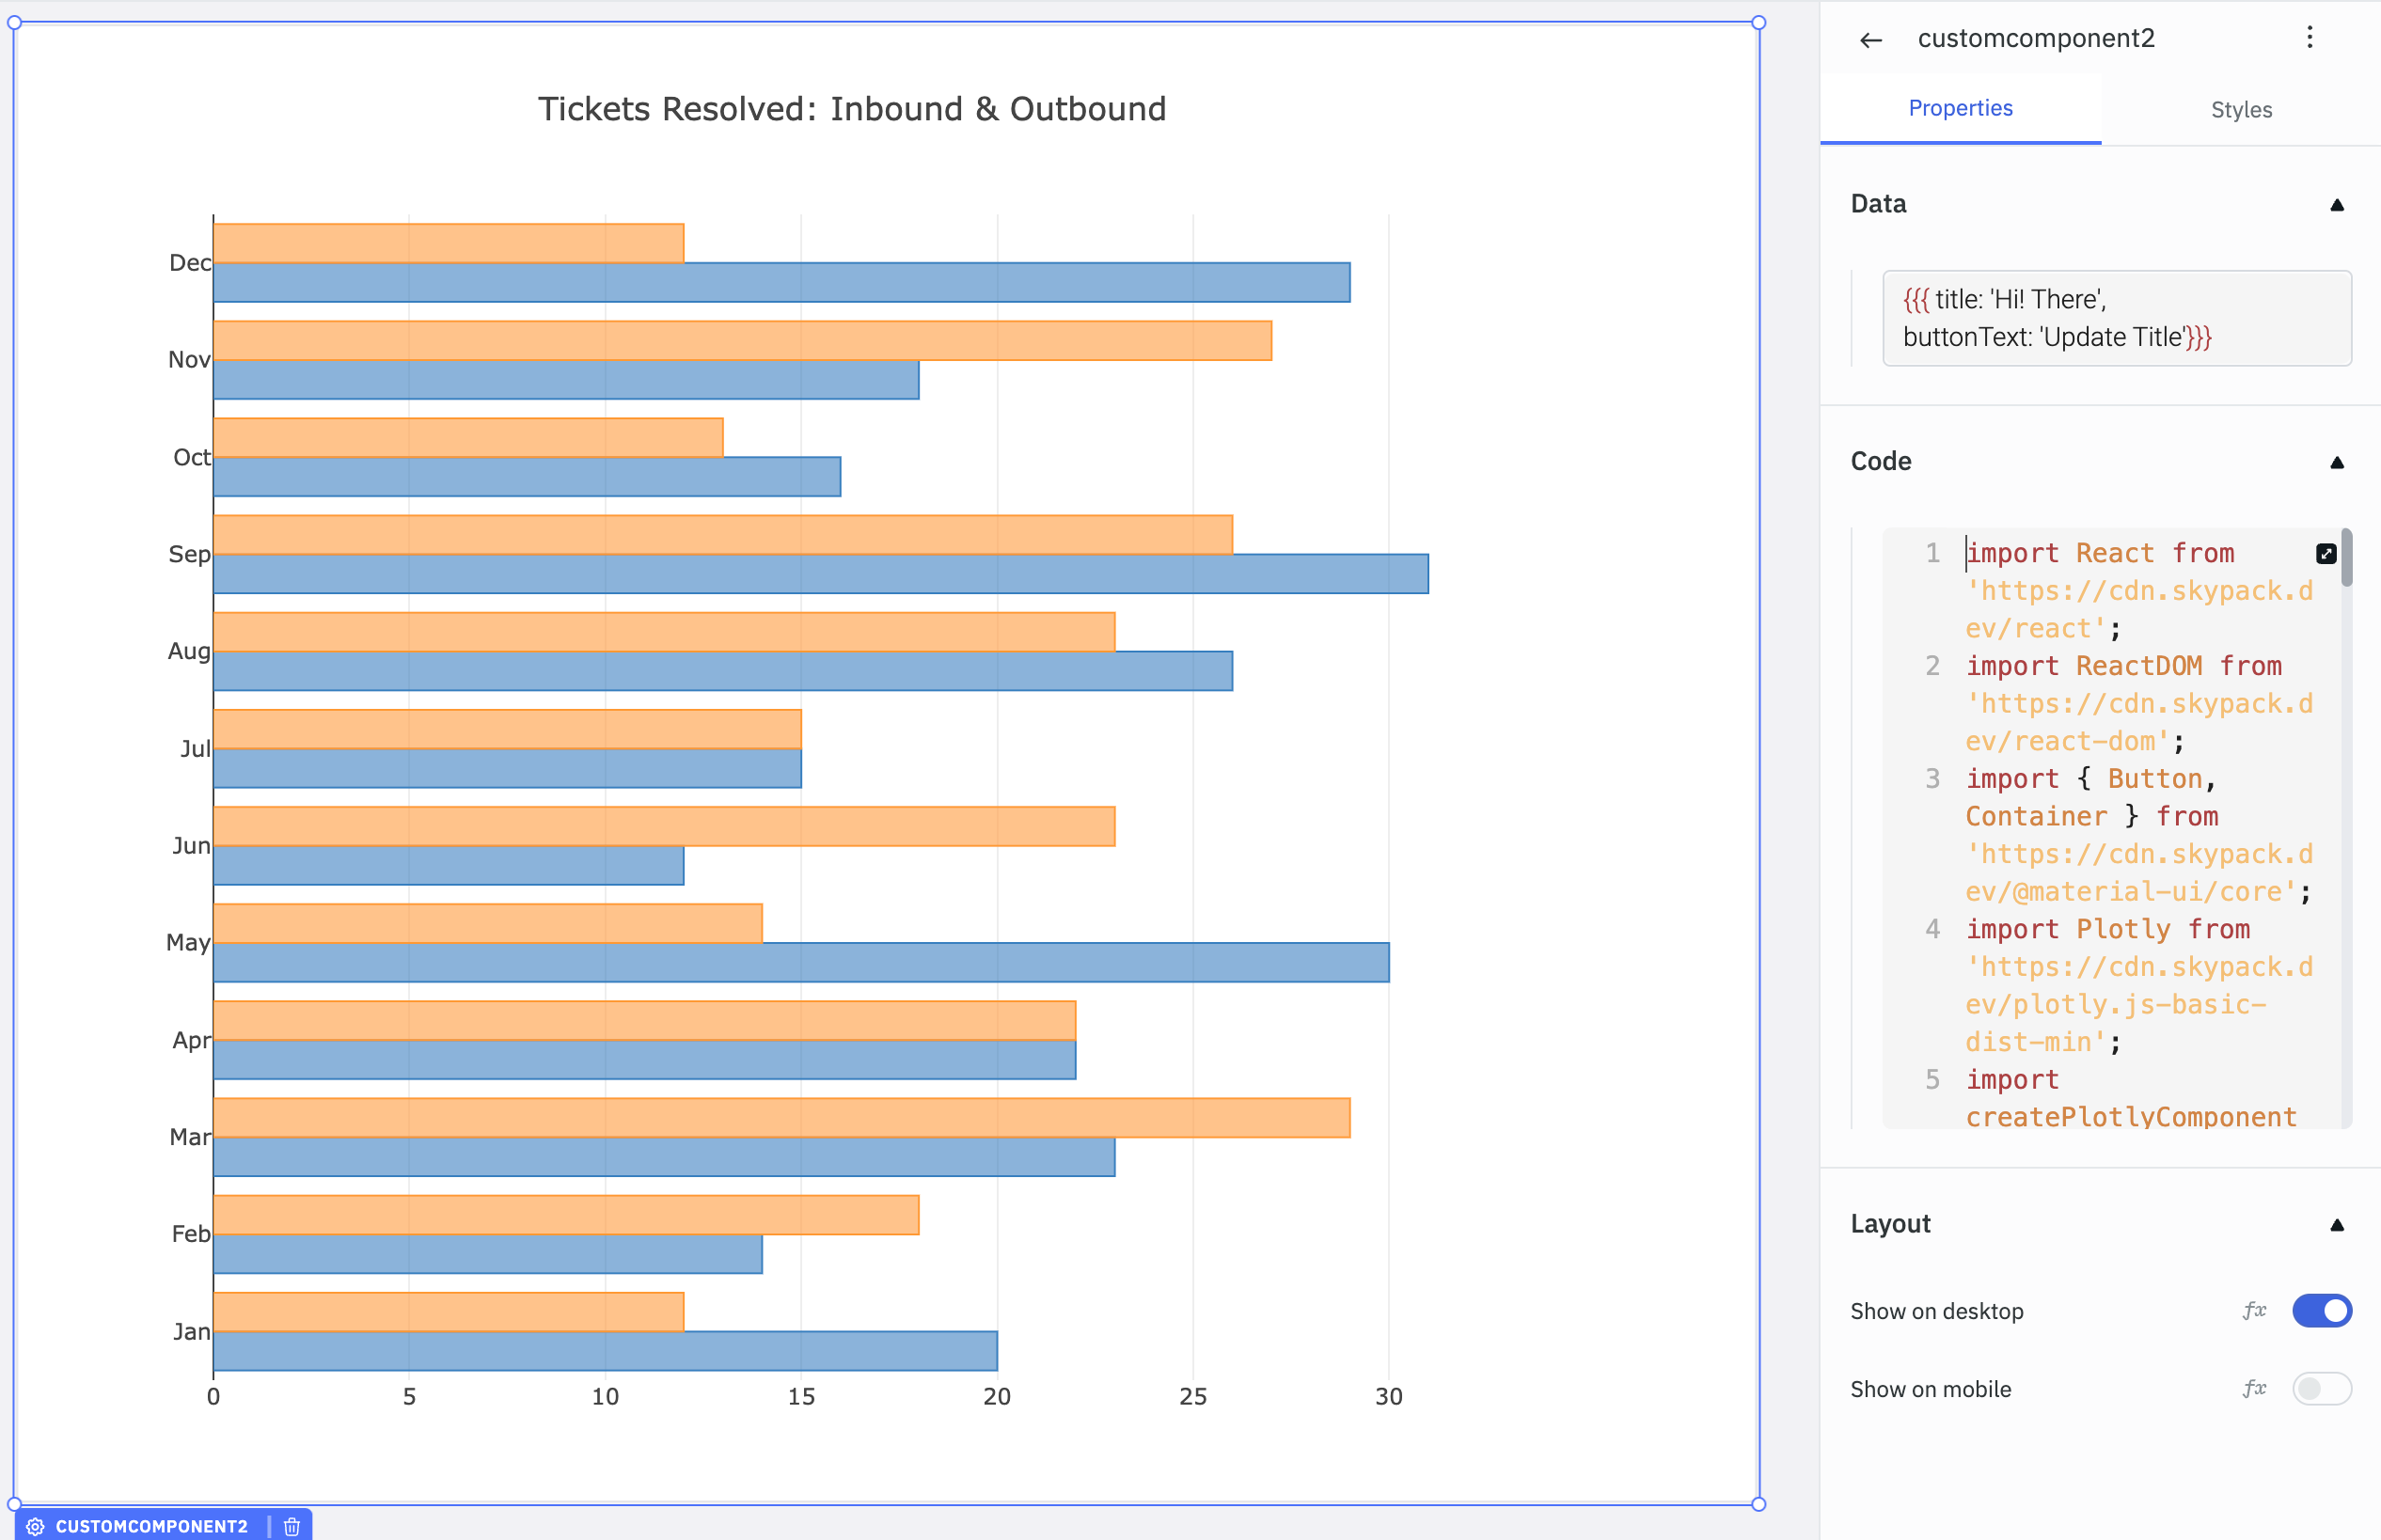
Step 1: Add a Custom Component
Open the App Builder and add a Custom Component to the page. Then, click on the Custom Component to open the Properties panel.
Note: If you are not familiar with the Custom Component, please read the Custom Component doc.
Step 2: Add the code to the Custom Component
import React from 'https://cdn.skypack.dev/react';
import ReactDOM from 'https://cdn.skypack.dev/react-dom';
import { Button, Container } from 'https://cdn.skypack.dev/@material-ui/core';
import Plotly from 'https://cdn.skypack.dev/plotly.js-basic-dist-min';
import createPlotlyComponent from 'https://cdn.skypack.dev/react-plotly.js/factory';

const MyCustomComponent = ({data, updateData, runQuery}) => {
const Plot = createPlotlyComponent(Plotly);

    const barOnClick = ({points}) => {
            alert('A bar is clicked')
    }
  return (
  <Container>
      <Plot data={[
        {
            "name": "Inbound",
            "type": "bar",
            "x": [
                20,
                14,
                23,
                22,
                30,
                12,
                15,
                26,
                31,
                16,
                18,
                29
            ],
            "y": [
                "Jan",
                "Feb",
                "Mar",
                "Apr",
                "May",
                "Jun",
                "Jul",
                "Aug",
                "Sep",
                "Oct",
                "Nov",
                "Dec"
            ],
            "marker": {
                "line": {
                    "color": "rgba(55, 128, 191, 1.0)",
                    "width": 1
                },
                "color": "rgba(55, 128, 191, 0.6)"
            },
            "orientation": "h"
        },
        {
            "name": "Outbound",
            "type": "bar",
            "x": [
                12,
                18,
                29,
                22,
                14,
                23,
                15,
                23,
                26,
                13,
                27,
                12
            ],
            "y": [
                "Jan",
                "Feb",
                "Mar",
                "Apr",
                "May",
                "Jun",
                "Jul",
                "Aug",
                "Sep",
                "Oct",
                "Nov",
                "Dec"
            ],
            "marker": {
                "line": {
                    "color": "rgba(255, 153, 51, 1.0)",
                    "width": 1
                },
                "color": "rgba(255, 153, 51, 0.6)"
            },
            "orientation": "h"
        }
        ]}
        layout={{
            width: 840,
            height: 800,
            title: "Tickets Resolved: Inbound & Outbound",
            showlegend: false,
        }}
        onClick={barOnClick}
        />
    </Container>
)}
const ConnectedComponent = Tooljet.connectComponent(MyCustomComponent);
ReactDOM.render(<ConnectedComponent />, document.body);
Let's understand the code above in detail. First, we imported the required libraries.
import React from 'https://cdn.skypack.dev/react'; // React library
import ReactDOM from 'https://cdn.skypack.dev/react-dom'; // React DOM library
import { Button, Container } from 'https://cdn.skypack.dev/@material-ui/core'; // Material UI library
import Plotly from 'https://cdn.skypack.dev/plotly.js-basic-dist-min'; // Plotly library
import createPlotlyComponent from 'https://cdn.skypack.dev/react-plotly.js/factory'; // Plotly React library
Then, we created a function component called MyCustomComponent. This component will render the chart. We use the createPlotlyComponent function to create a Plotly component. Then, we create a function called barOnClick that will be called when the user clicks on the bar. This function will display an alert message.
const MyCustomComponent = ({data, updateData, runQuery}) => { // function component
const Plot = createPlotlyComponent(Plotly); // create a Plotly component

    const barOnClick = ({points}) => { // function that will be called when the user clicks on the bar
            alert('A bar is clicked')   // display an alert message
    }
Next, we render the chart using the Plot component. We pass the data and layout to the Plot component. We also pass the barOnClick function to the onClick prop of the Plot component.
  return ( // return the Plot component
  <Container> // Material UI Container component
      <Plot data={[  // Plot component
        { // data for the first bar
            "name": "Inbound",
            "type": "bar",
            "x": [
                20,
                14,
                23,
                22,
                30,
                12,
                15,
                26,
                31,
                16,
                18,
                29
            ],
            "y": [
                "Jan",
                "Feb",
                "Mar",
                "Apr",
                "May",
                "Jun",
                "Jul",
                "Aug",
                "Sep",
                "Oct",
                "Nov",
                "Dec"
            ],
            "marker": {
                "line": {
                    "color": "rgba(55, 128, 191, 1.0)",
                    "width": 1
                },
                "color": "rgba(55, 128, 191, 0.6)"
            },
            "orientation": "h"
        },
        { // data for the second bar
            "name": "Outbound",
            "type": "bar",
            "x": [
                12,
                18,
                29,
                22,
                14,
                23,
                15,
                23,
                26,
                13,
                27,
                12
            ],
            "y": [
                "Jan",
                "Feb",
                "Mar",
                "Apr",
                "May",
                "Jun",
                "Jul",
                "Aug",
                "Sep",
                "Oct",
                "Nov",
                "Dec"
            ],
            "marker": {
                "line": {
                    "color": "rgba(255, 153, 51, 1.0)",
                    "width": 1
                },
                "color": "rgba(255, 153, 51, 0.6)"
            },
            "orientation": "h"
        }
        ]}
        layout={{ // layout for the chart
            width: 840,
            height: 800,
            title: "Tickets Resolved: Inbound & Outbound",
            showlegend: false,
        }}
        onClick={barOnClick} // pass the barOnClick function to the onClick prop
        />
    </Container>
)}
Finally, we render the MyCustomComponent component using the ReactDOM.render function.
const ConnectedComponent = Tooljet.connectComponent(MyCustomComponent); // connect the component to the Tooljet store
ReactDOM.render(<ConnectedComponent />, document.body); // render the component
Step 3: Using events from the Custom Component
In the code above, we created a function called barOnClick that will be called when the user clicks on the bar. This function holds the code that will be executed when the user clicks on the bar.
const barOnClick = ({points}) => {
        alert('A bar is clicked')
}
Instead of displaying an alert message, you can use the runQuery function to run a query.
const barOnClick = ({points}) => {
        runQuery('queryName')
}
runQuery is a function which accepts a query name as a string used to run the query from the custom component. Learn more about the custom component here.