Left-sidebar
Left-sidebar has the following options:
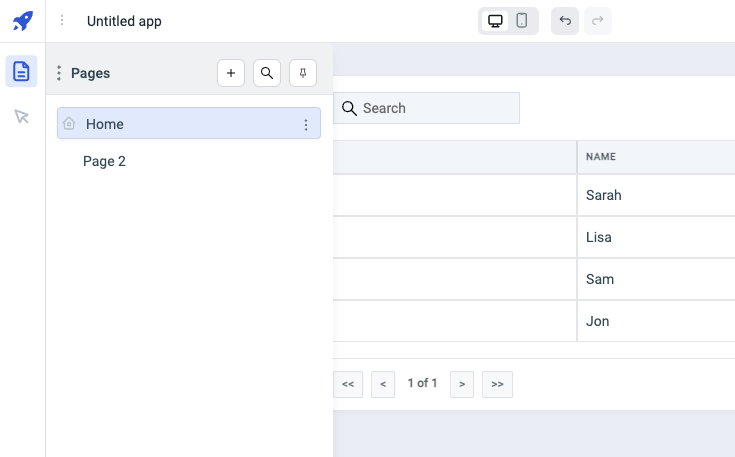
Pages
Pages allows you to have multiple pages in a single application, making your ToolJet applications more robust and user-friendly.
Check the detailed documentation for Pages.
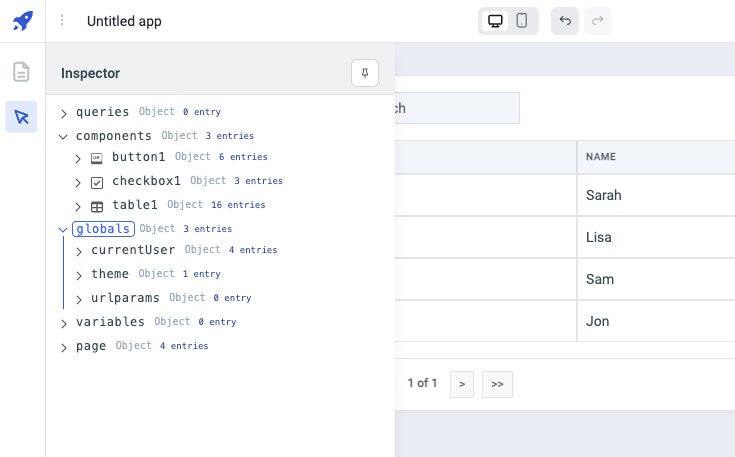
Inspector
The Inspector can be used to inspect the data of the queries, properties and values of the components that are there on the canvas, ToolJet's global variables and the variables that have been set by the user.
Check the detailed guide on using Inspector.
Debugger
Debugger records any errors that occur during the execution of queries. For instance, if a database query fails because the database is unavailable or if a REST API query fails due to an incorrect URL, the errors will be captured and shown in the debugger. Additionally, the debugger provides pertinent information associated with the error alongside the error message.
If you wish to prevent the debugger from closing, you can simply click on the pin icon located in the top-right corner. By doing so, the debugger will stay open until you decide to unpin it.
Debugger consists of two main sections:
-
All Log: In this section, you can view a comprehensive list of all the logs generated during the execution of the application. These logs may include various types of messages, such as success messages, warning, and error messages.
-
Errors: This section specifically focuses on displaying the error messages that occurred during the program's execution. These error messages indicate issues or problems that need attention, as they may lead to unexpected behaviors of the application.
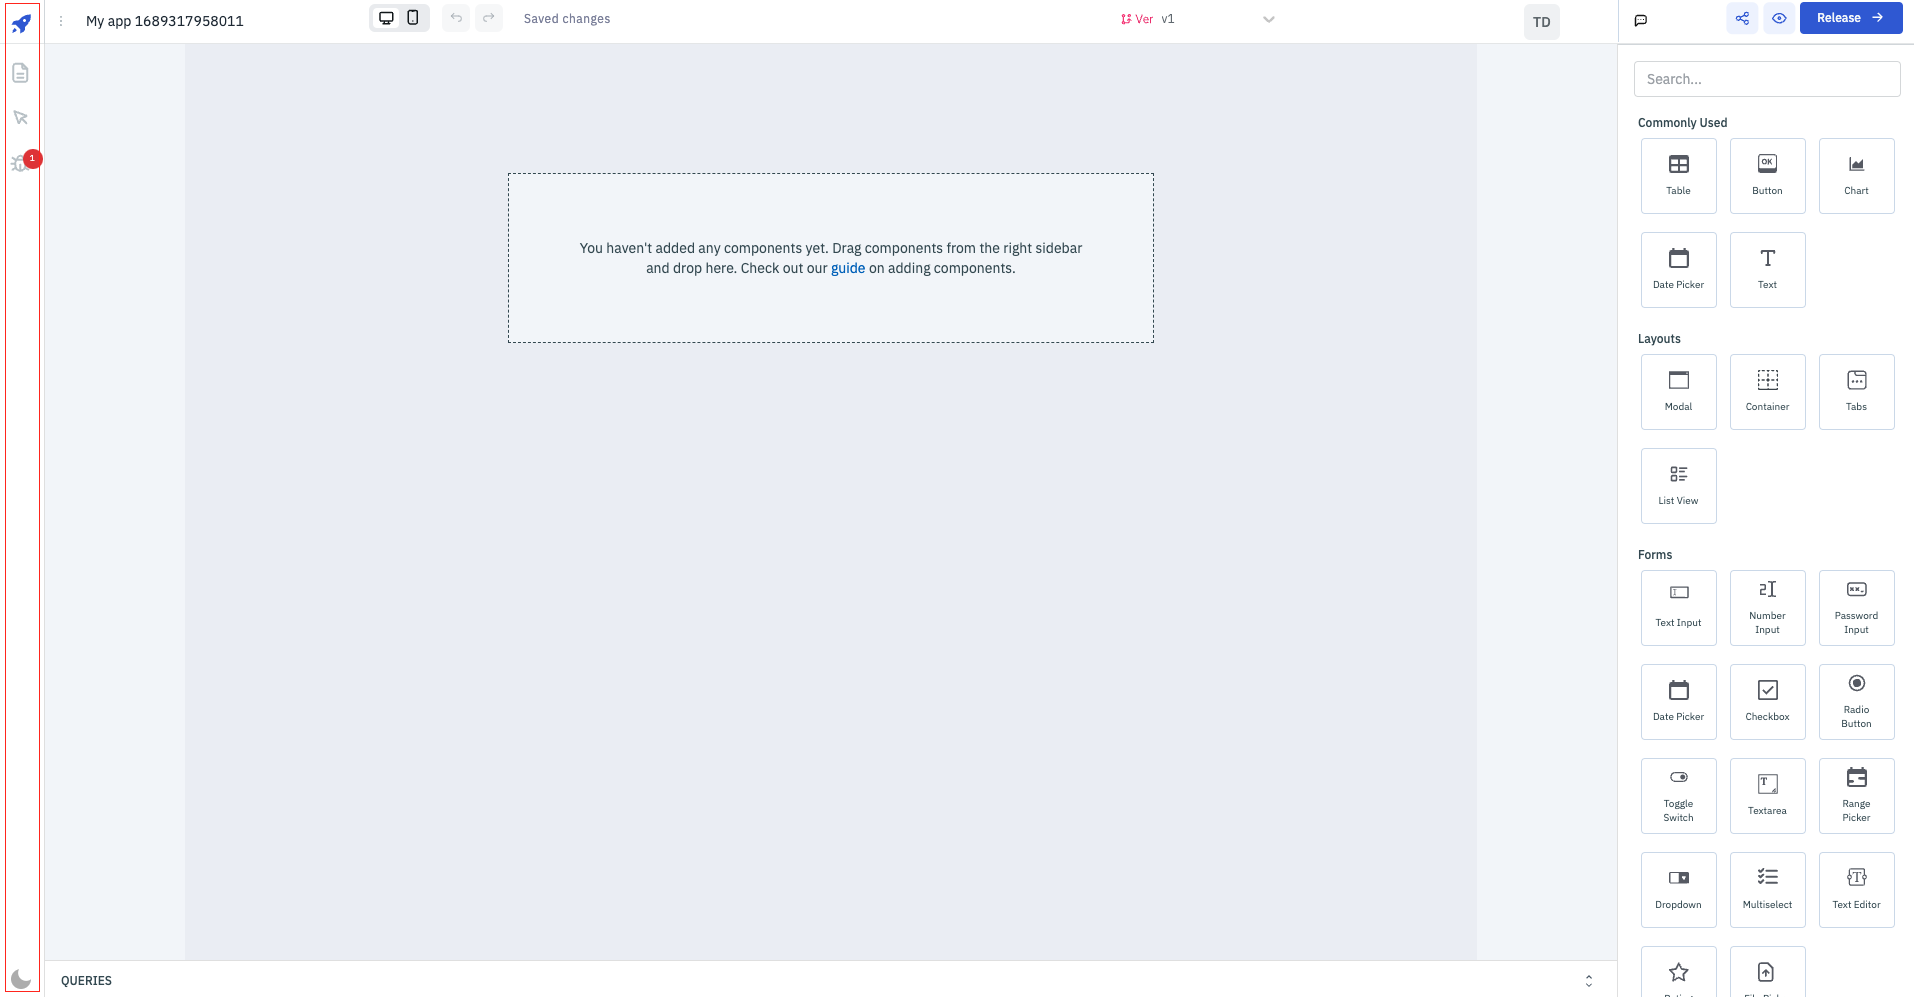
Theme Switch
Use the theme switch button to toggle ToolJet between light and dark modes.
While developers can access the current theme's value through global variables using {{globals.theme.name}}, it is not currently feasible to change the theme programmatically.