Change text color in columns by accessing cellValue and rowData in the table
In this how-to guide, we will build an app that will use a sample RestAPI to display the data in the table, and then we will change the text color of the columns according to the condition.
- Let's start by creating a new application and then adding a table widget into the canvas.
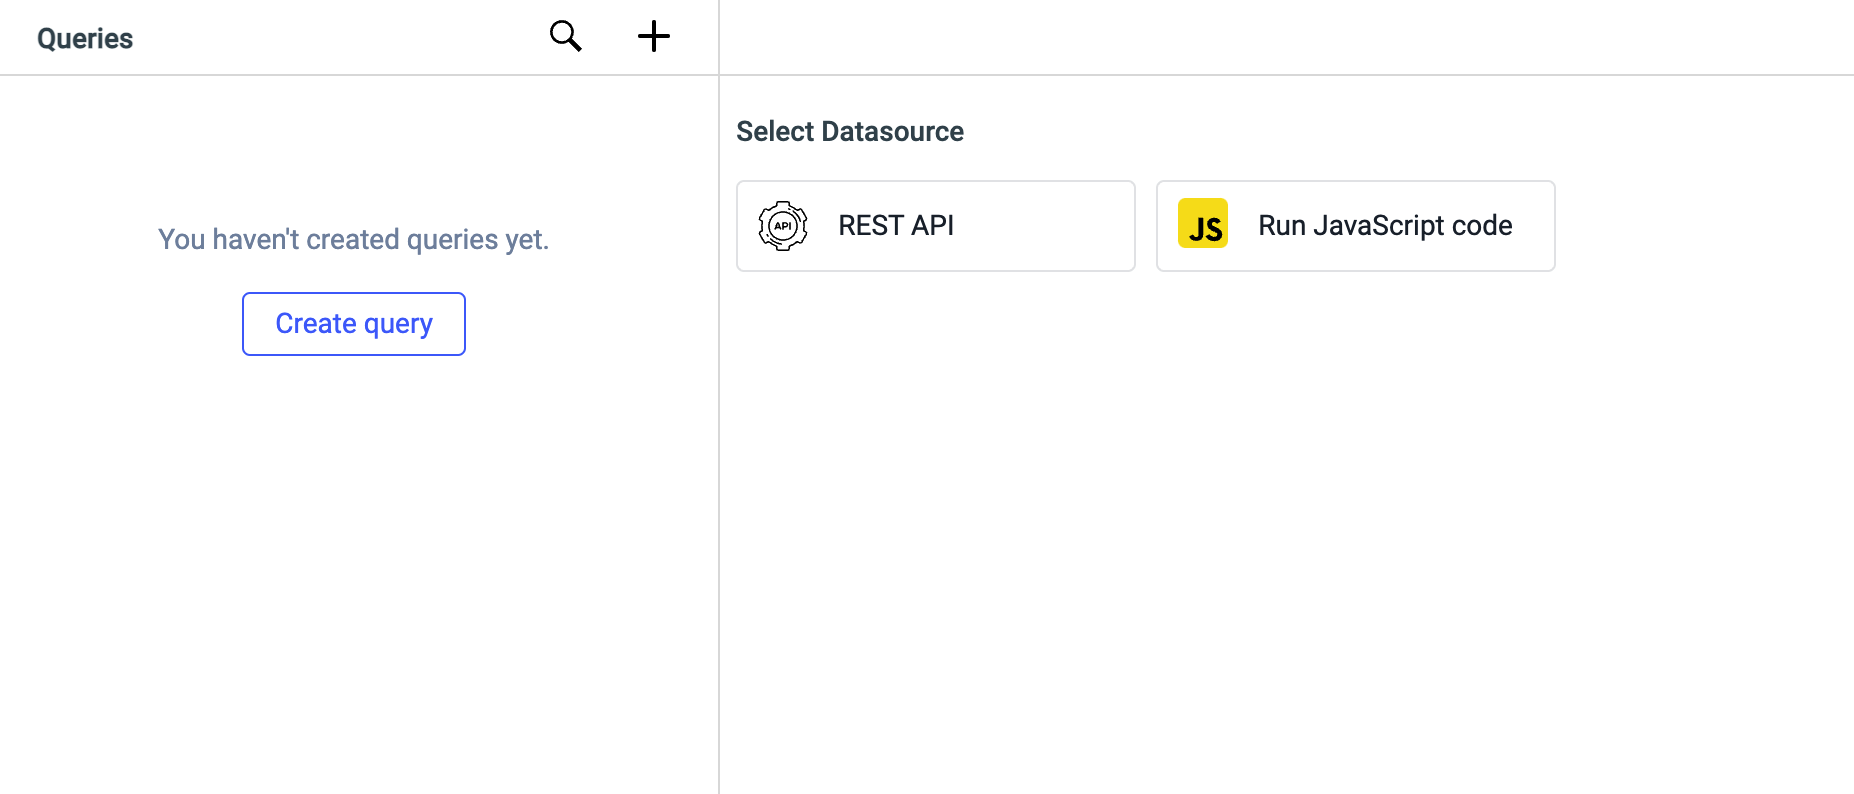
- Now go to the Query Panel at the bottom of the app editor and click on the
+button. - Choose RestAPI data source
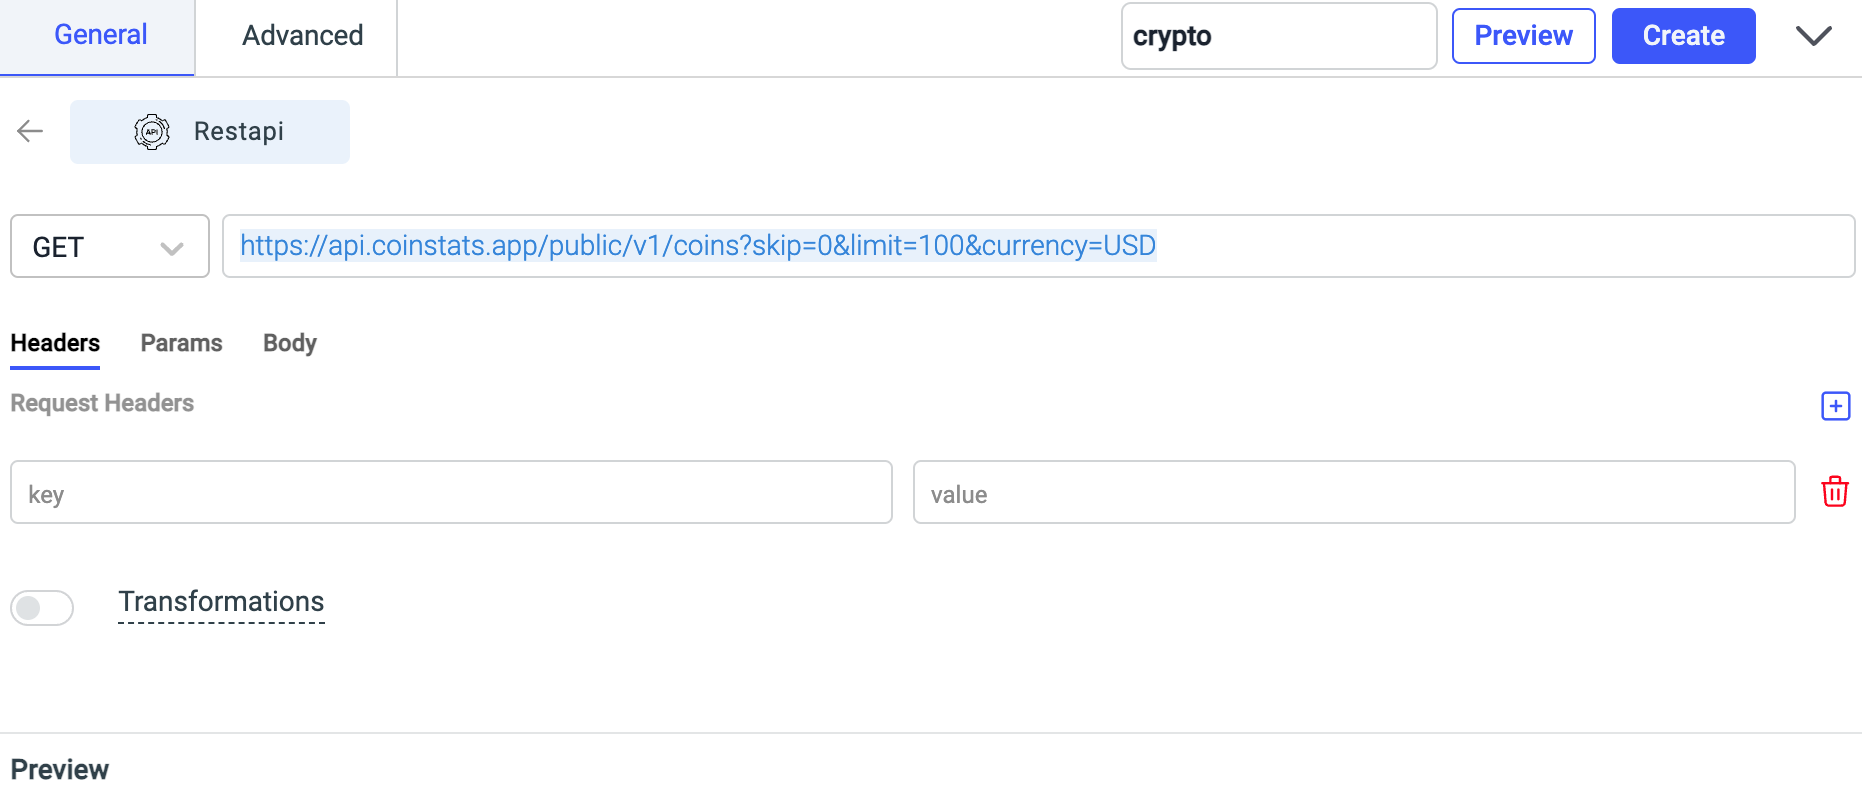
- Now we will use a sample RestAPI endpoint - I have used the API provided by coinstats.app, API-URL: https://api.coinstats.app/public/v1/coins?skip=0&limit=100¤cy=USD
- Choose
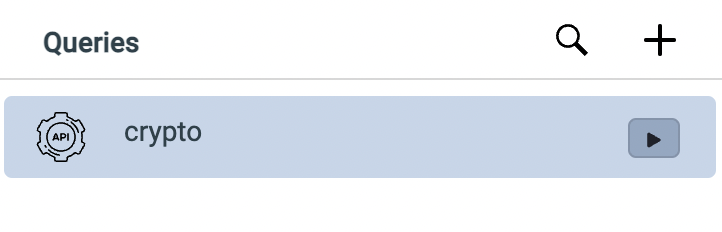
GETmethod, enter the request URL (API URL in previous step), name the query - I have named itcrypto, and then Create the query
- Now hit the Run button next to the query name to run the query.
- Once you run the query, you can check the data returned by the query in the Inspector on the left sidebar.
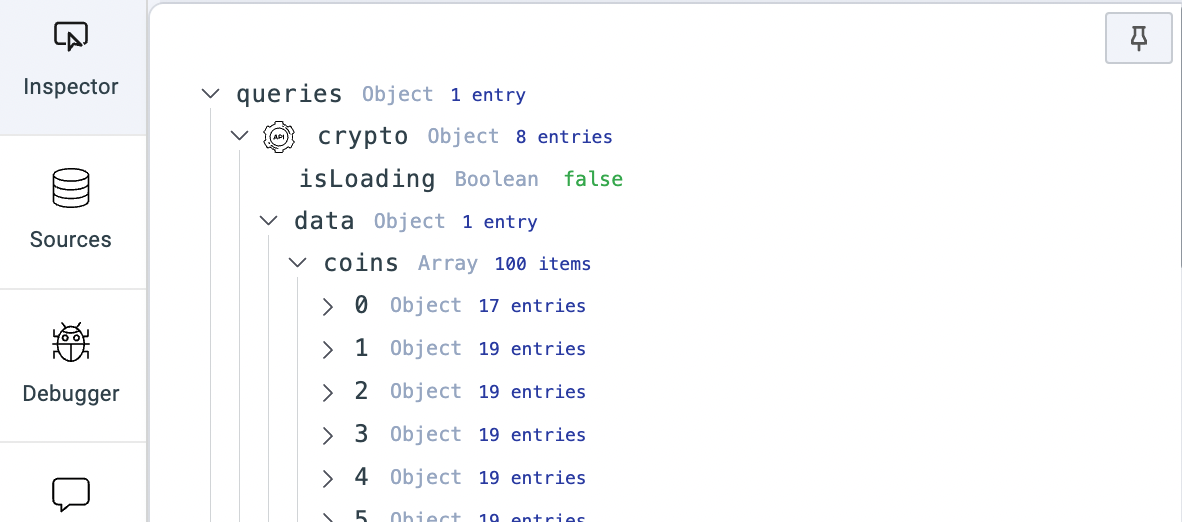
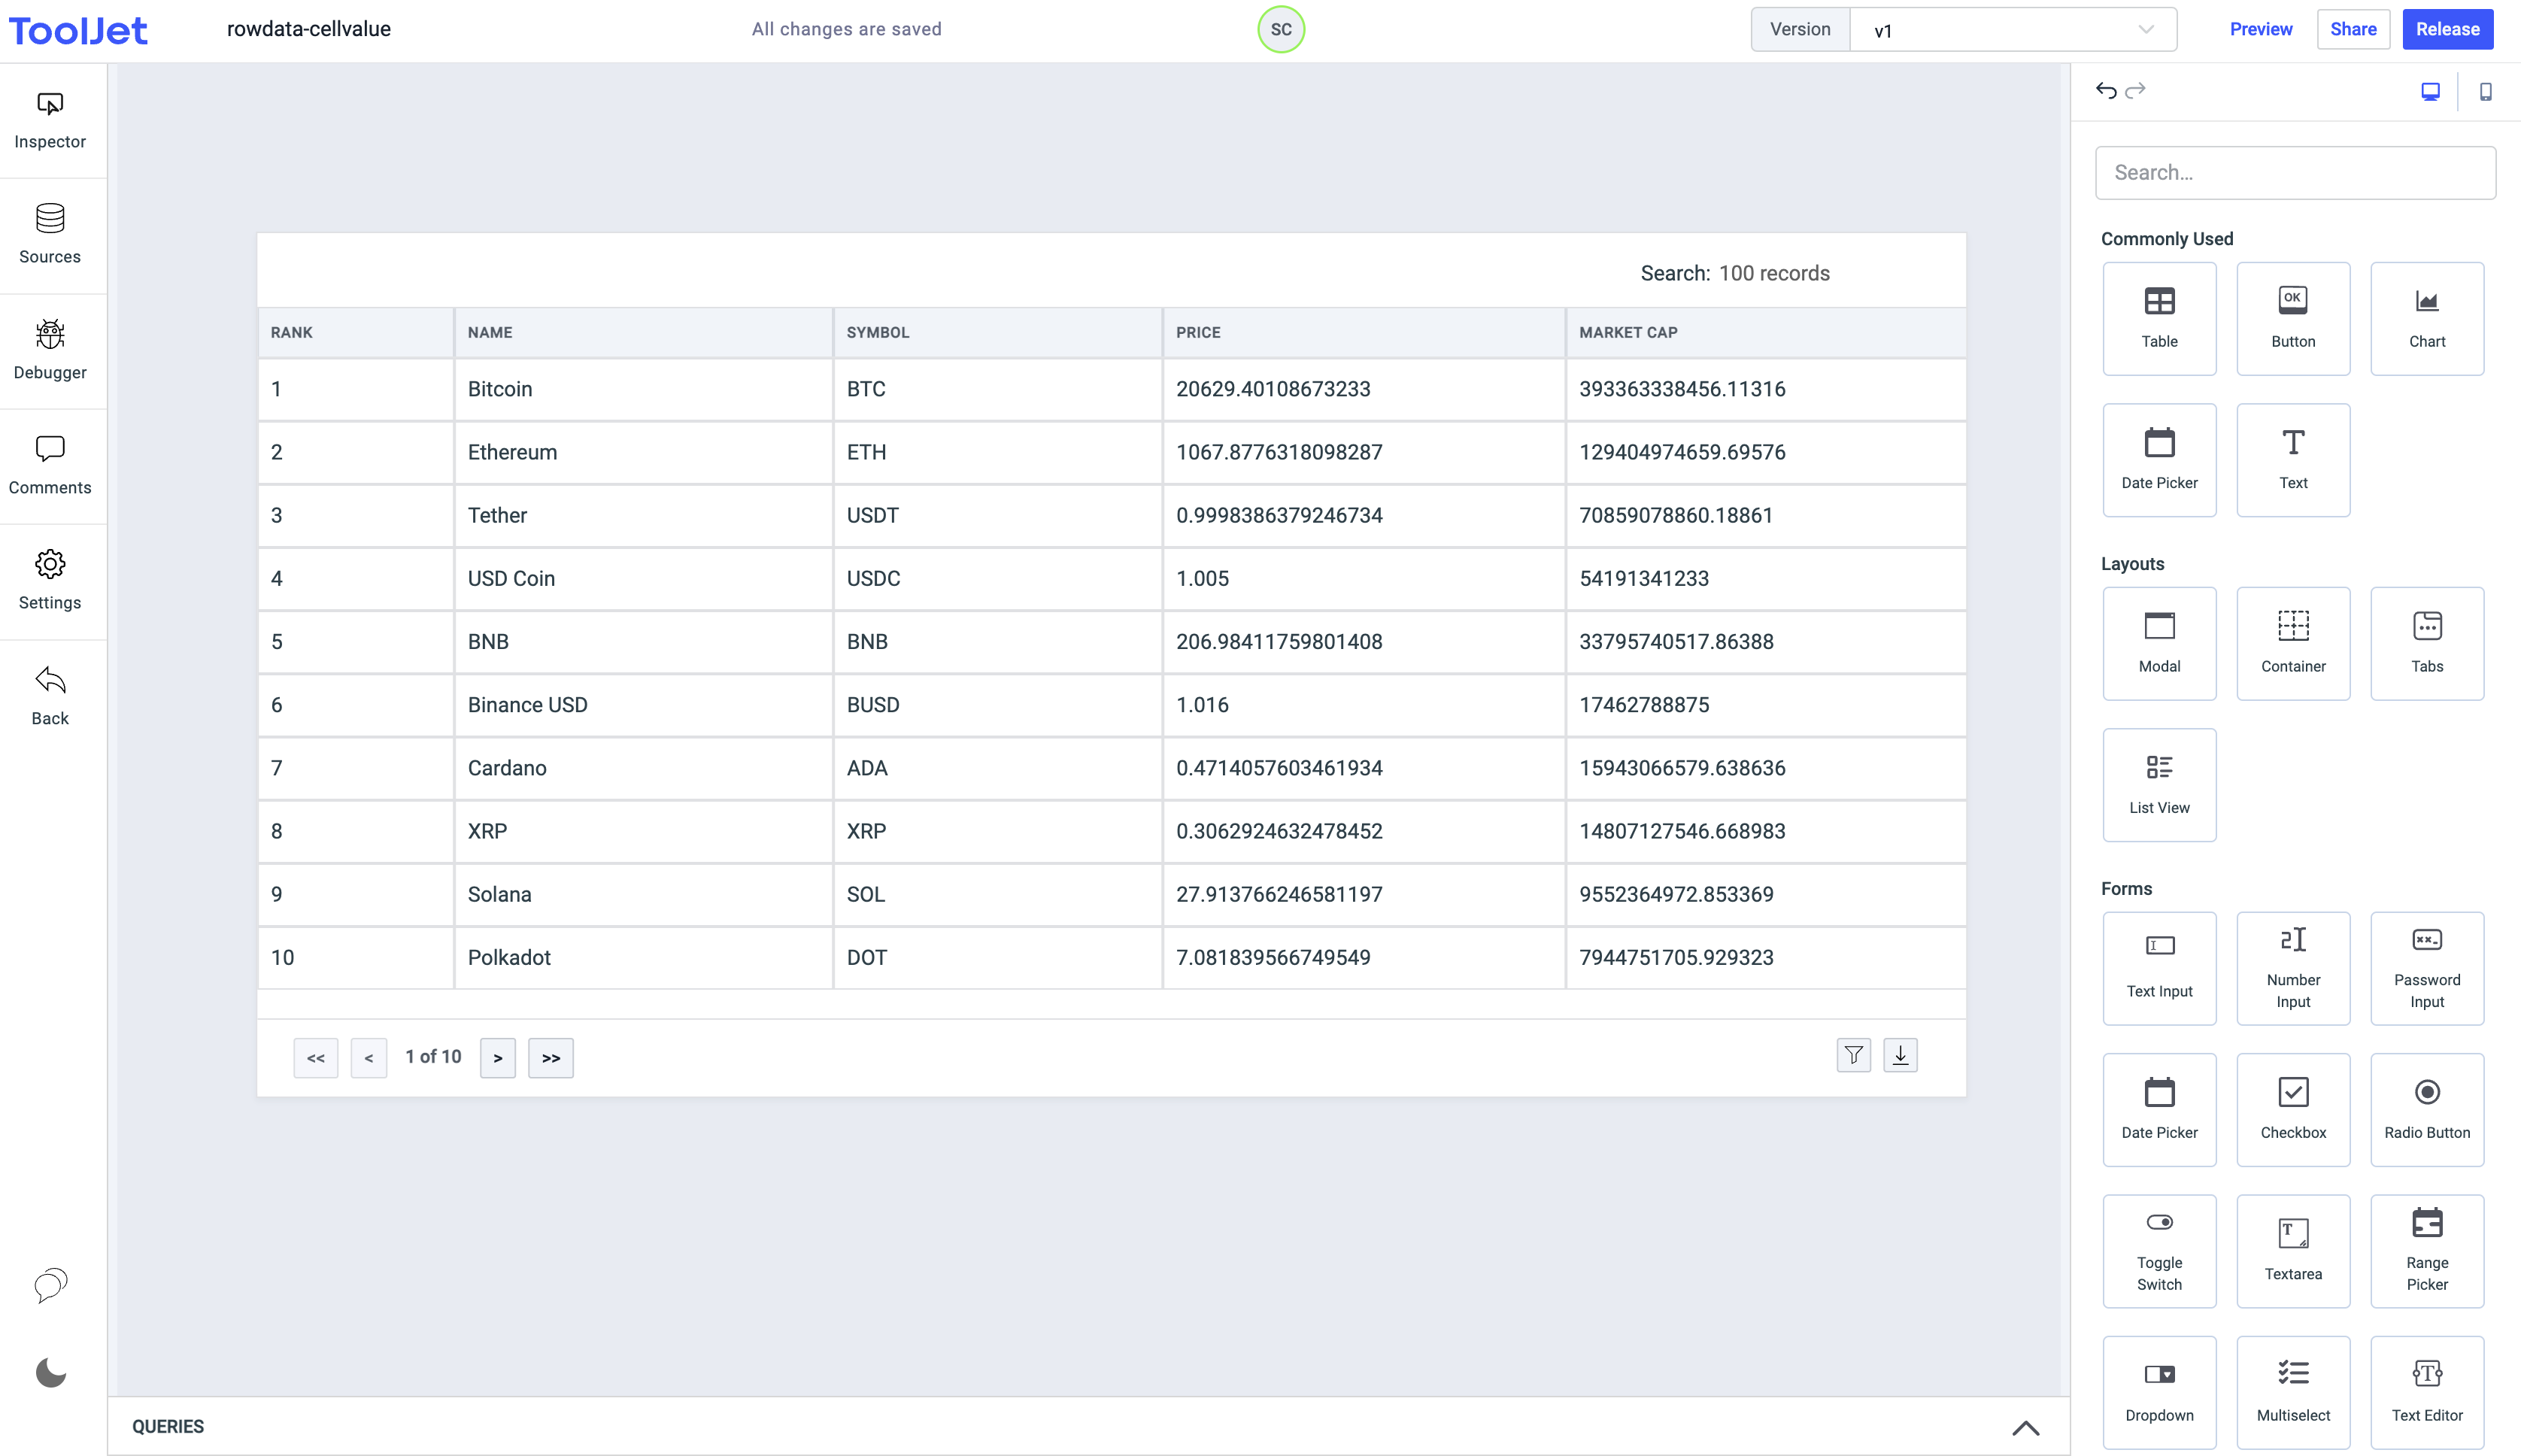
- Now that we have got the data, we will display it on the table. To do this, click on the widget handle of the table to open its properties in the right sidebar.
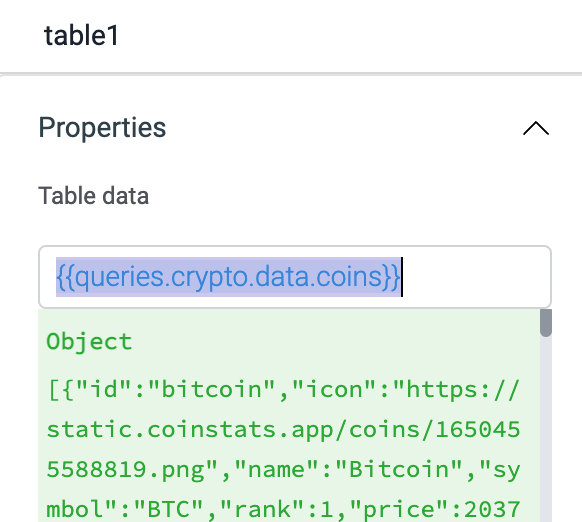
- In the Table Data field, enter
{{queries.crypto.data.coins}}- as you can see in the screenshot of the inspector the data is inside thecoinsarray. You'll see the data in the Preview(green box) below the field.
- Let's add the columns that we want to display on the table. Go to the Columns section, Add columns, set their Names, and set key for each column. I have added 5 columns: Rank, Name, Symbol, Price, and Market Cap.
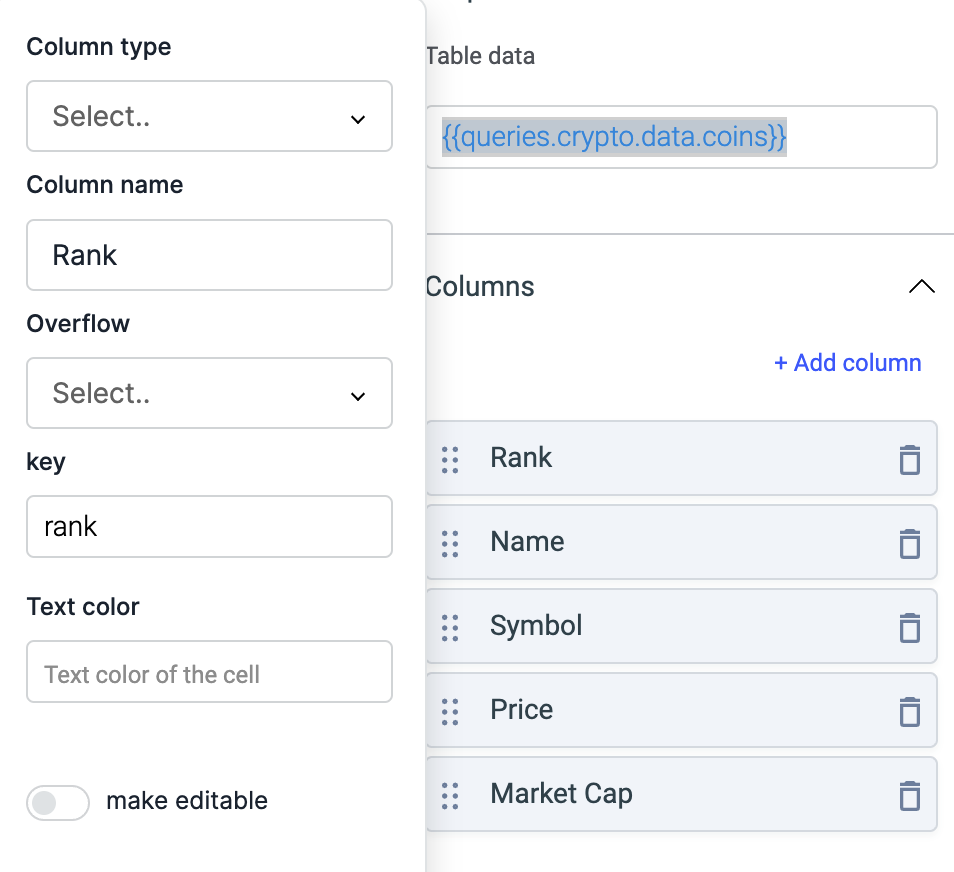
- Once you've added the columns, you'll get the table like this:
Using cellValue to change column text color
Now that we have our data on the table, we will change the color of the text in the Price and Market Cap columns.
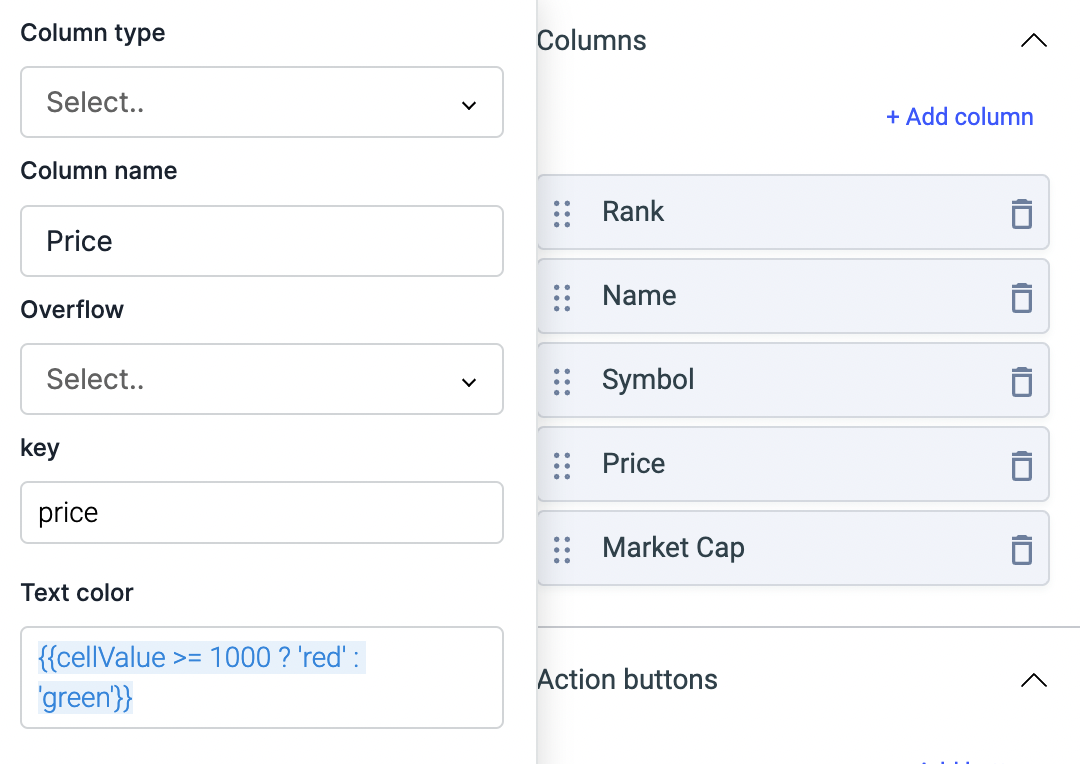
- Edit table properties, go to Columns, and click on the Price Column to open its properties.
- For Price column, we want to change color of those cells who have value which is greater than 1000 to red else to green if it is less than 1000. So to do this, we will set a condition in Text Color property of this column:
{{cellValue >= 1000 ? 'red' : 'green'}}
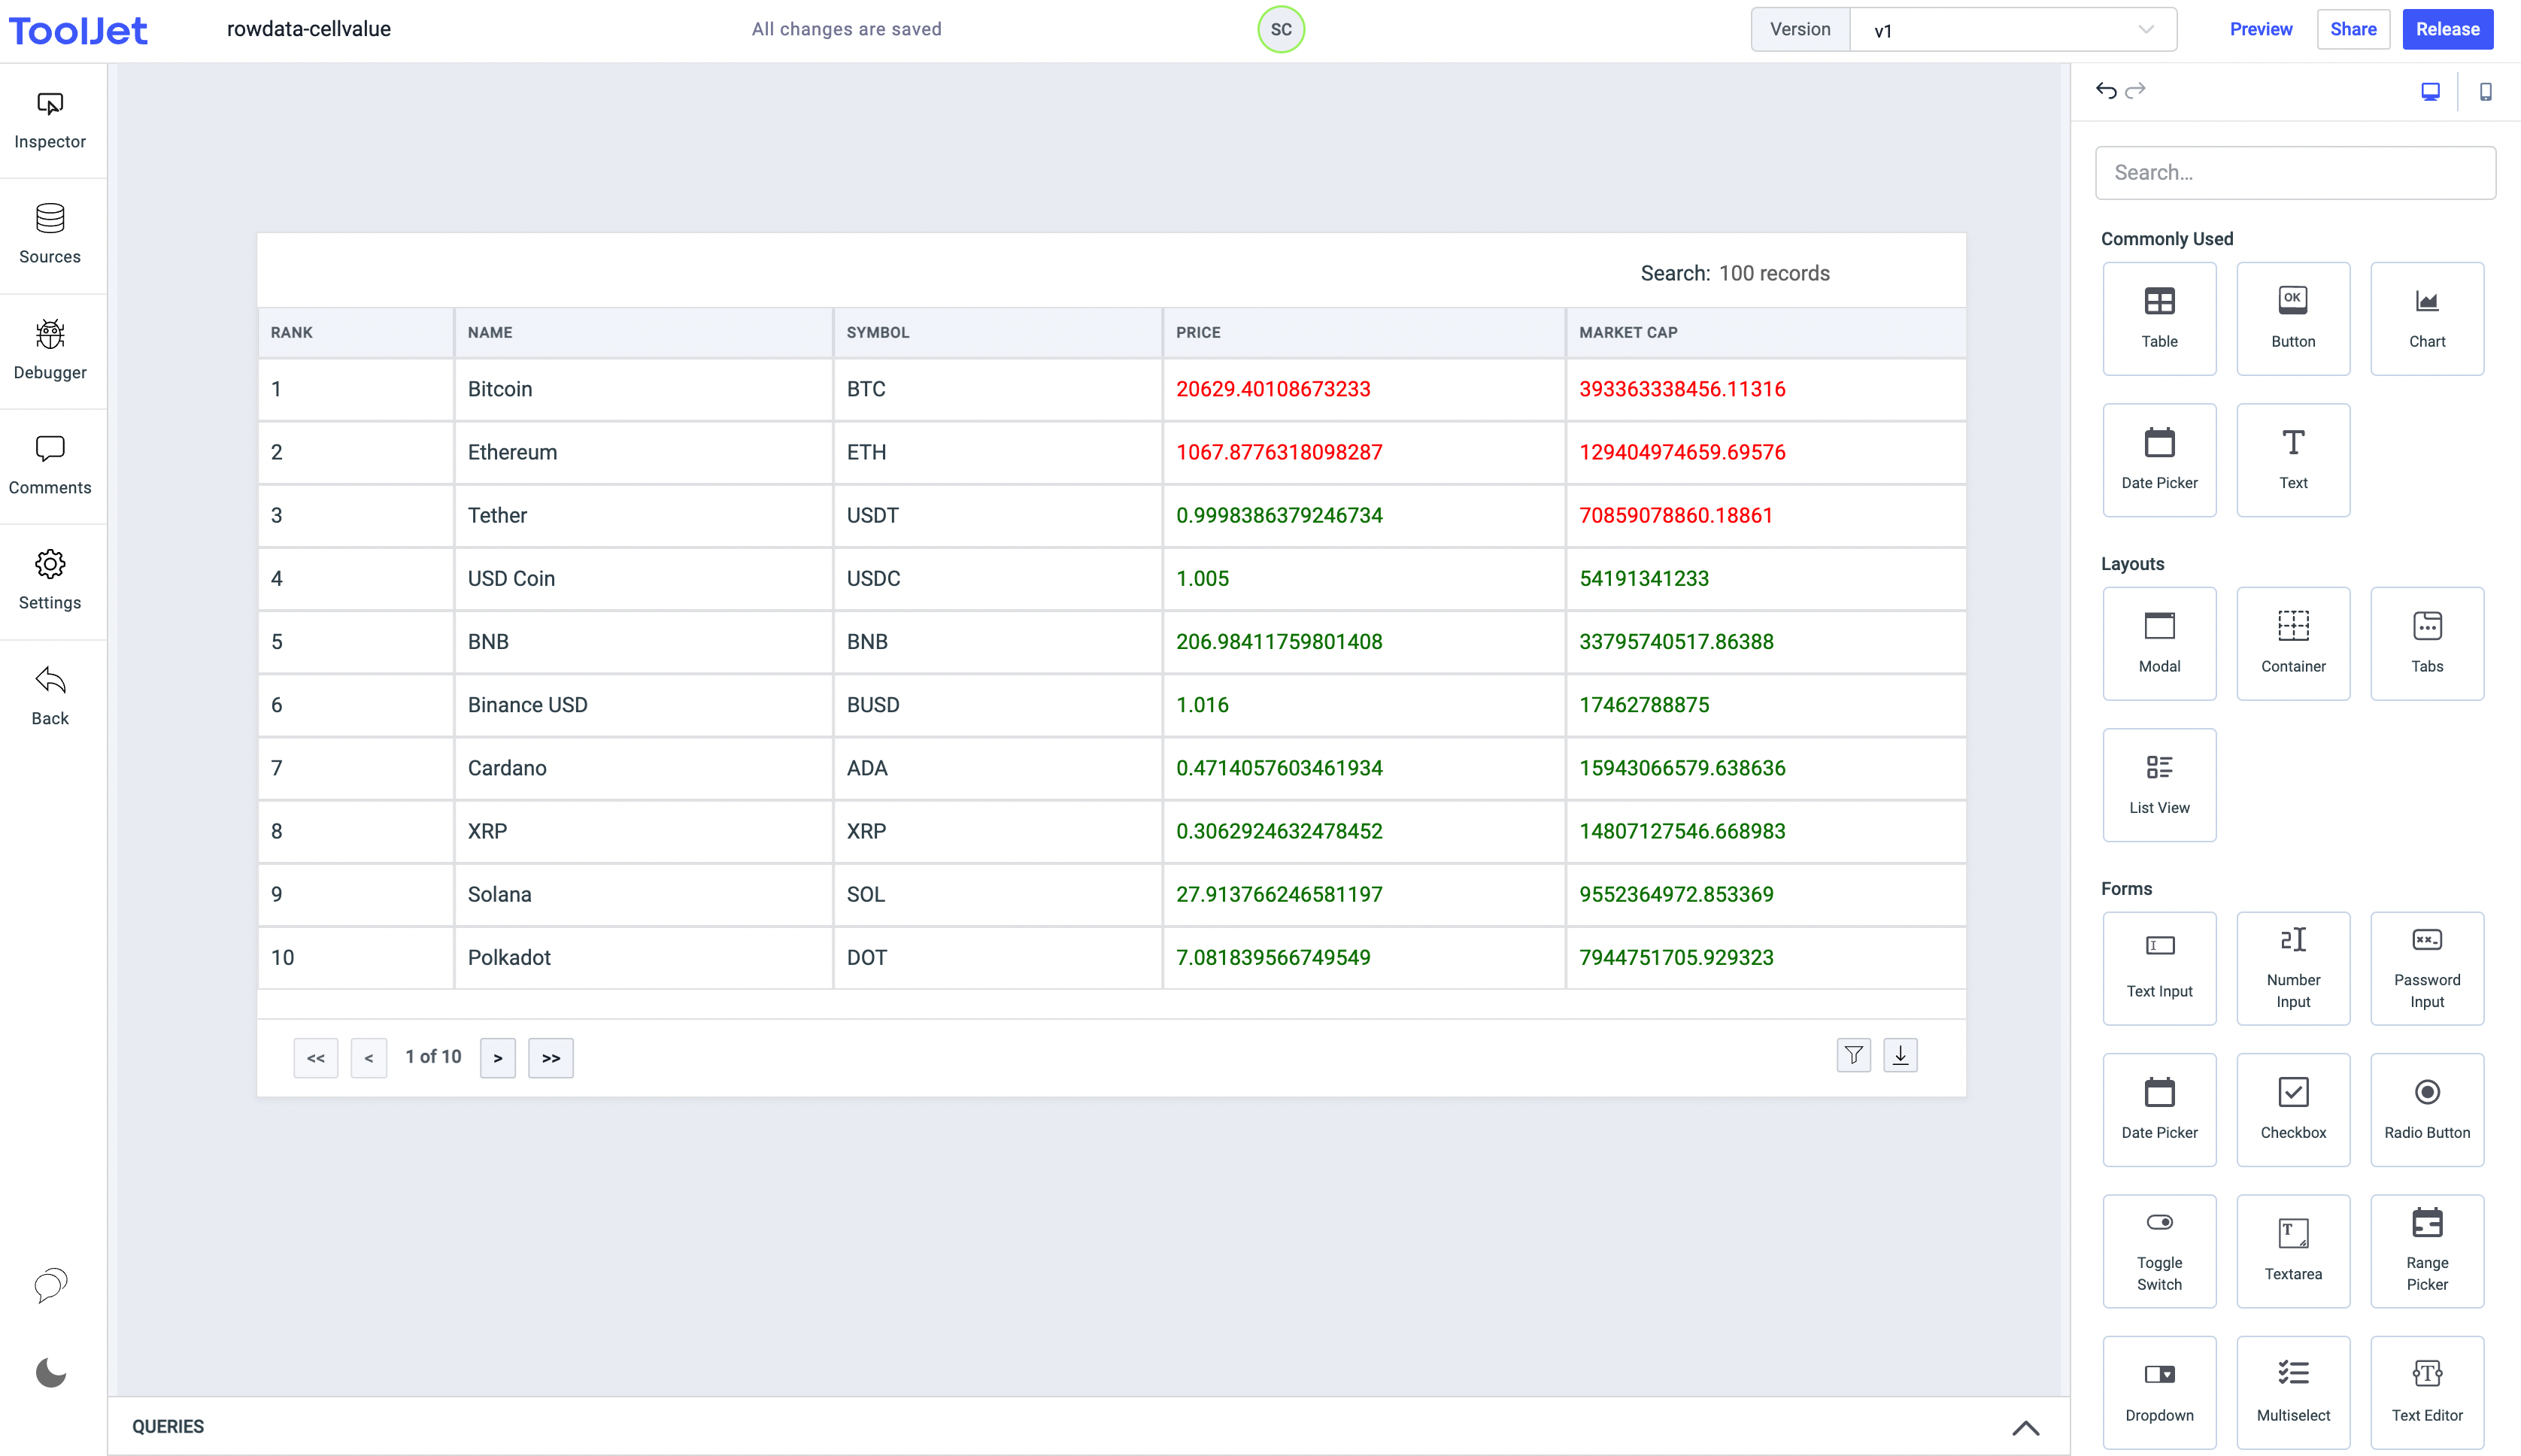
- Similarly, we will do for Market Cap column. We want to change the text color of those cells who have value which is greater than 60000000000 to red else to green if it is less than 60000000000. so the condition will be
{{cellValue >= 60000000000 ? 'red' : 'green'}} - Now the text color of cells in the columns will be updated.
info
You can also use Hex Color Code instead of mentioning color in plane text.
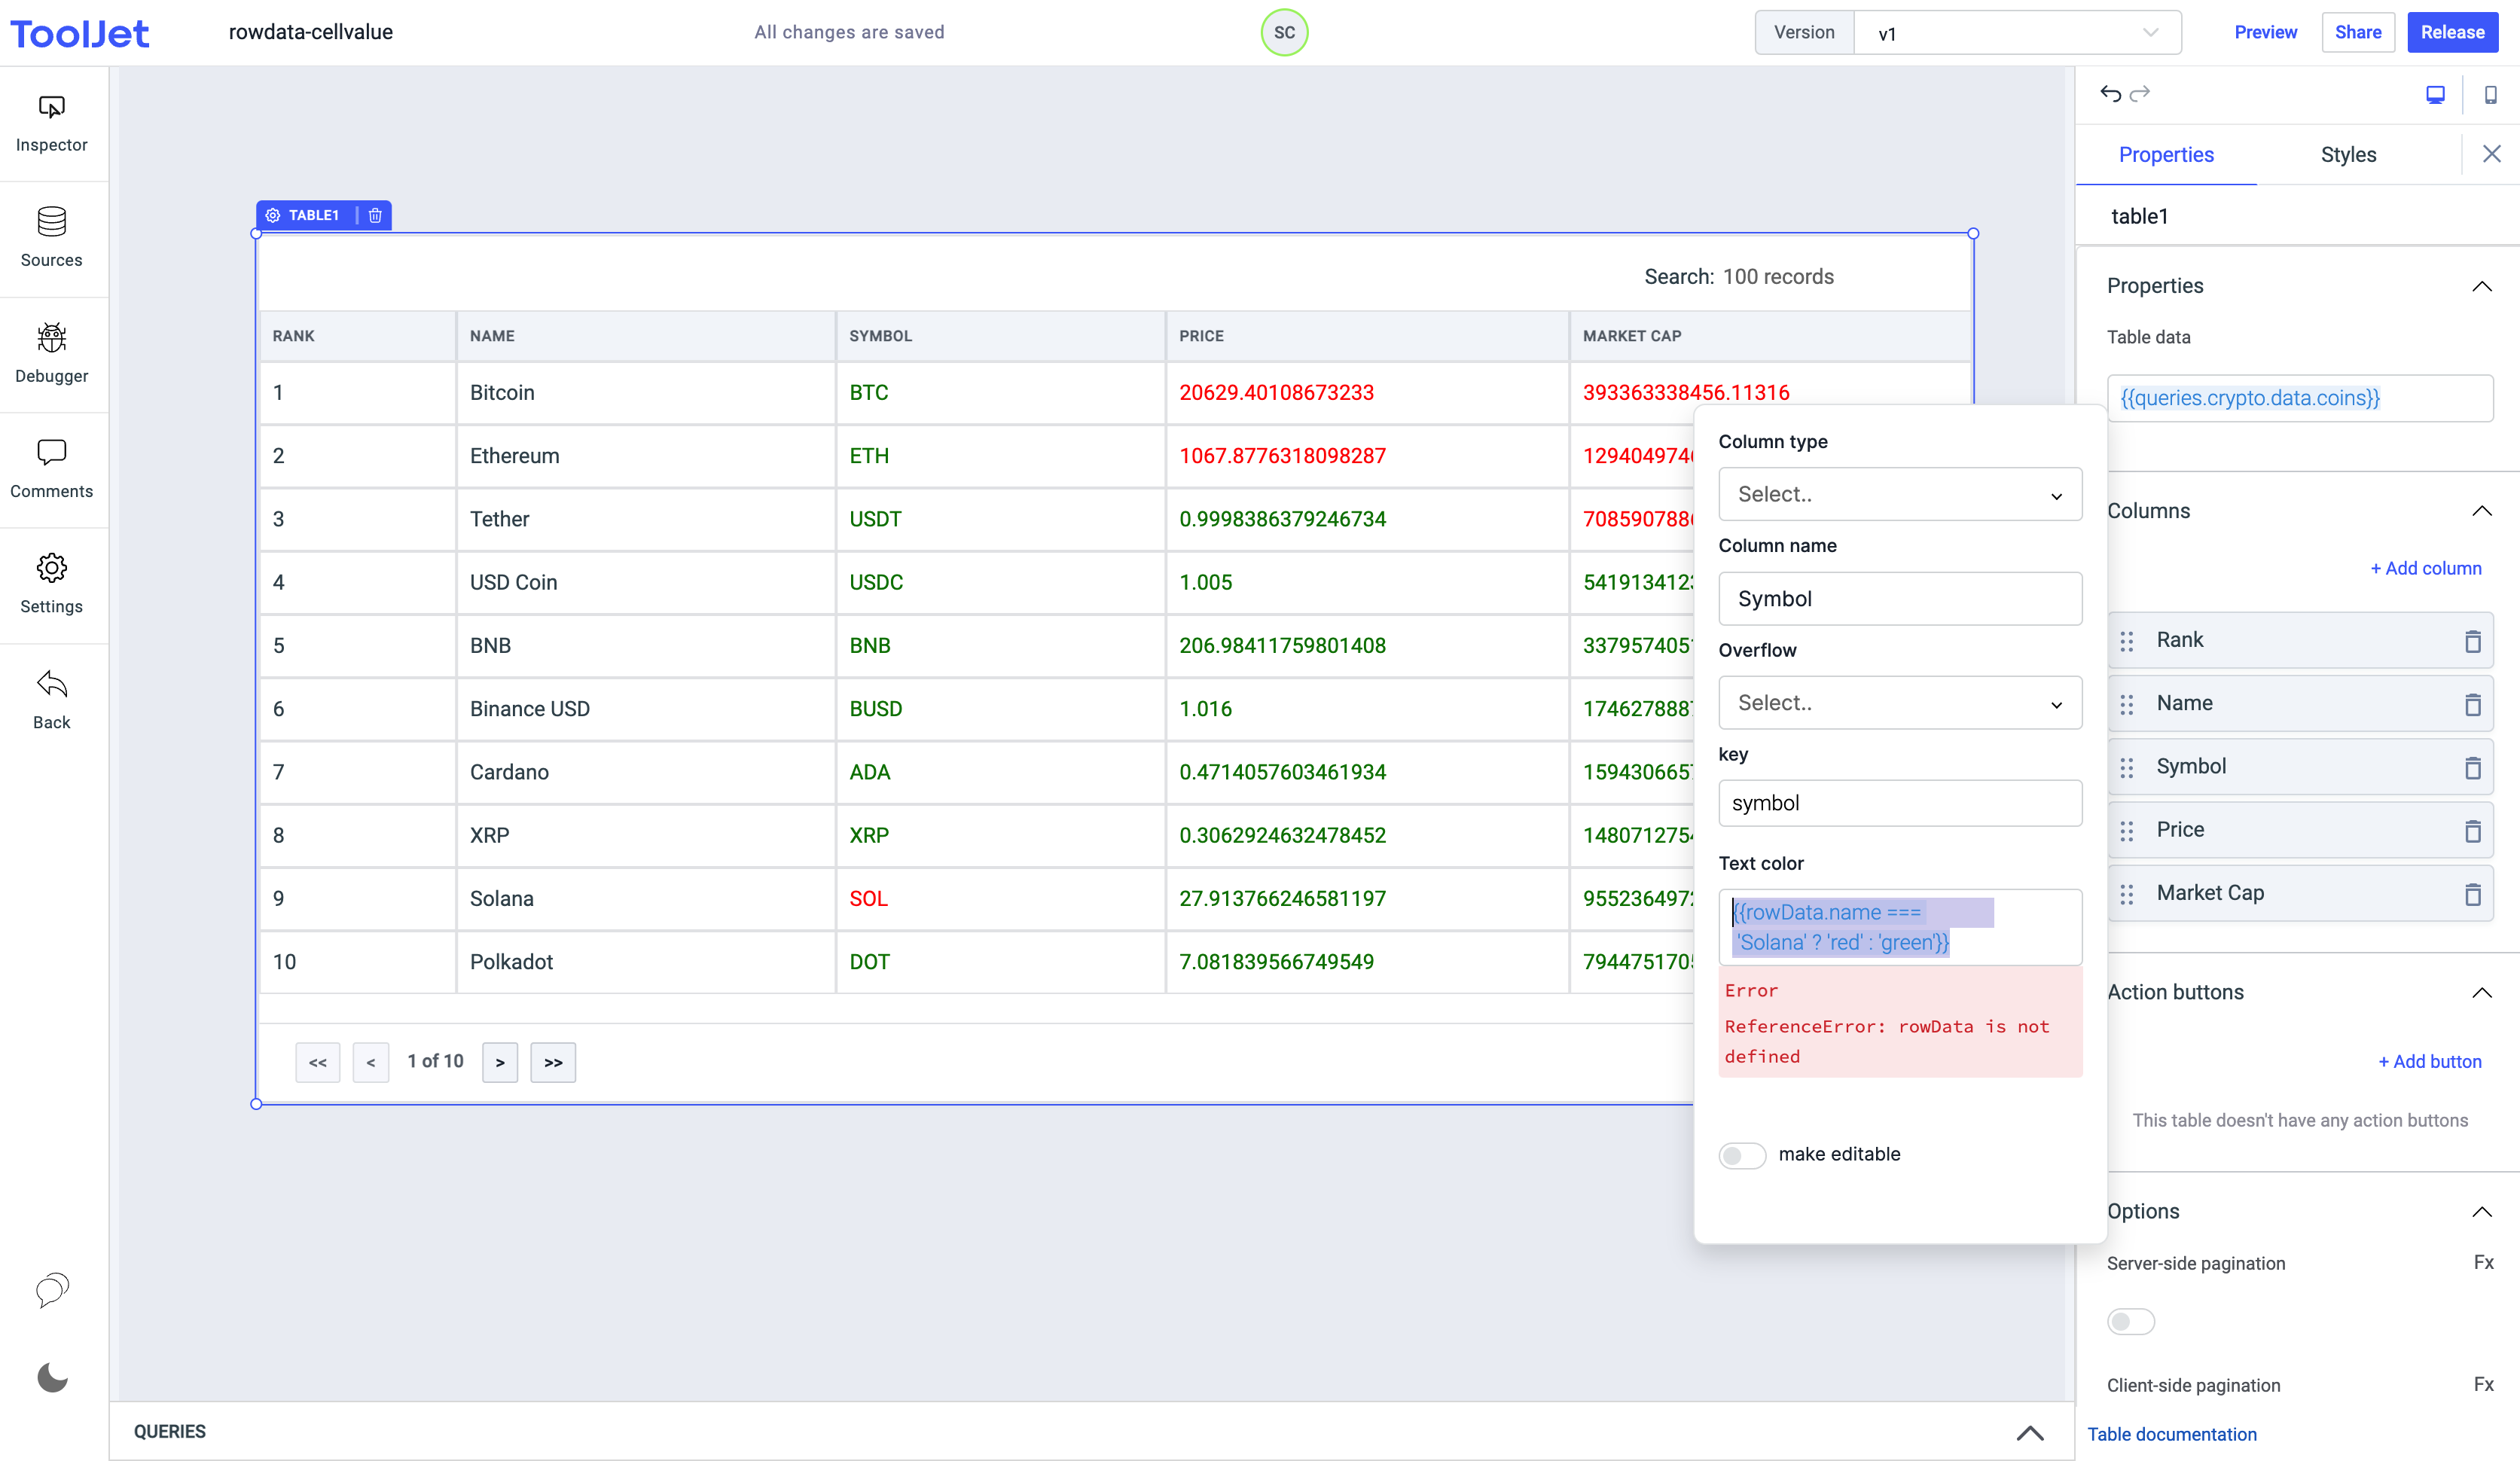
Using rowData to change column text color
- To change the color of the text using
rowDatavariable it is required to mention the column name whose cell value we will be comparing in the condition. Let's take a look by changing the text color of Symbol column. - We will add a condition to look in the row data and if the row has column called
namewhich has valueSolanathen it should change the color to red else the color should be green. - Edit the properties of the Symbol column, set the Text Color field value to
{{rowData.name === 'Solana' ? 'red' : 'green'}}. - You'll see that in the Symbols column all the values has become green except the one that has Solana in Name column.